Sideline to Sideline: CFP Clemson
For this special edition series of Sideline to Sideline revolving around the 2019 College Football Playoff, SEC Statcat is tweaking it's normal structure. Instead of doing one, big long article chocked full of the advanced analytics, playcall trends, and stat nuggets you know and love, we will be presenting a number of articles geared around all three playoff games. The Sideline to Sideline pieces will consist of deep dives on each playoff offense as well as breakout articles examining certain aspects of all four teams like their quarterbacks, schedule, and offensive weapons to mention a few.
Instead of evaluating each team by their entire body of work, SEC Statcat charted each of the title contender's four best defenses faced per ESPN's SP+ metric. To be concise, this is the Worldwide Leader's blanket stat that measures potency, explosiveness, scoring, and down-to-down success relative to their opponent, field position, and a few other factors. But, I will bring this metric up from time-to-time, so keep in mind what it is.
Sure, each of these schools have varying degrees of difficulty in terms of the teams they have faced. But by looking at their "four hardest games", we're able to get a better depiction of what to expect from these guys in the playoff.
Another buzz term I will be using in great volume is "Success Rate". All yards aren't created equal, and Success Rate applies situational conditions that need to be met in order for a play to be "successful". In case you are unaware, a successful play must gain 50% of yards to gain on 1st Downs, 70% of yards to gain on 2nd Downs, and 100% of yards to gain on 3rd/4th Down.
I talk about X's and O's in terms of concepts quite often. To help educate the less savvy fan, the majority of the ones mentioned in these pieces have hyperlinks to "Gridiron 101" tutorials that explain them in further detail in a quick video.
In this piece, SEC Statcat will be analyzing the Clemson Tigers. Their four toughest defenses they've faced per ESPN's SP+ are Texas A&M, North Carolina, South Carolina, and Virginia.
Clemson's Offense at a Glance:
Tested or no, Clemson is a very skilled team. When you have one of the best passers in college football surrounded by an extremely capable supporting cast, you can beat anyone. And so far they have. Clemson is the first team to come in as a preseason No. 1, go undefeated, and finish outside the top2 in the final poll in over 40 years. This isn't a slight at the Tigers' talent but rather their meek resume. It goes without saying that when a 4-8 South Carolina team is the second hardest defense they've faced this season per ESPN's SP+, but Clemson hasn't been through the trials of the other playoff contenders.
Looking at their entire schedule, it shouldn't shock you Clemson comes in with the easiest slate. While it's not their fault most of the ACC is trash, there's no getting over that stigma regarding their lack of top-flight victories. Sure they thumped two teams teetering on the edge of the Top25, but many teams -- including non-playoff squads -- can make that claim.
They check a lot of boxes and get high marks on the old fashioned eye test. They rank 3rd nationally in offensive yards per game and total touchdowns and have the fourth best yards/play. Their quarterback is often labeled as a "generational talent". Their running back was the Player of the Year in the ACC averaging nearly 9 yards per carry over the course of the season. At a place quickly becoming known as "Wide Receiver U", Clemson has another pair of dynamic down-the-field threats.
But despite dropping six 50-burgers in the regular season and a 60-whopper in the ACC Championship against Virginia, Clemson only posts the 3rd best "Relative Scoring Offense" among the playoff teams. This translates to how much better an offense scores on average compared to what it's competition allows. For example: Team A scored 28 points against Team B who usually allows 14. Team A's RSO would then be 200% (28/14 x 100).
The defenses they've faced have been dunked on more than Shawn Bradley. So even with the eye-popping final scores, this metric just doesn't look at them the same way as Ohio State and LSU. Clemson's RSO on the year is 163.1%. And when looking at this against their four hardest opponents, Clemson is the only playoff team who's RSO gets worse versus the meat of their schedule. In their games against Texas A&M, North Carolina, South Carolina, and Virginia, their RSO shrinks to 134.4%.
To recap, they have had the easiest schedule, least difficult top4 opponents, and yet have the worst Relative Scoring Offense versus those four foes. In fact, their RSO against top competition is over 23 percentage points lower than the next closest title contender. Their first team's 46.2% Scoring Rate - or percentage of drives that result in points - also is the lowest.
Evaluating Clemson's offense versus its top4 defenses faced per ESPN's SP+, the Tigers don't necessarily run anything fancy. While the second-most pass happy team in the playoff behind LSU, most of their success comes on the ground. Aided by a softer slate, Clemson's Rushing Success Rate and Explosive Run Rate are tops among title contenders. Like a good deal of offenses these days, they incorporate reads into the majority of their run schemes. Plus, they have called more RPOs (Run-Pass Options) on average than any other playoff team. Nearly 28% of their plays against top competition have been RPOs and 17.1% of Trevor Lawrence's attempts have targeted route tags on read options - the most by 6.5 percentage points among the four playoff passers.
But despite being the most outstanding, wonderful, highest-graded, and premier running back in the ACC, Travis Etienne has been their least efficient runner against their hardest opponents --by a lot. Among playoff backs with at least 12 carries, Etienne has the lowest yards per carry (4.83) and the second-lowest Success Rate (44.1%). Only Ohio State's Major Teague has been less successful running the rock down-to-down than Etienne. Both Lyn-J Dixon and T-Law have the two best Success Rates among playoff ball carriers. Dixon has far and away been the best sporting a 67.9% clip against their top4 defenses faced. No other player has one over 59%. For what it is worth, the top2 most successful rushers in the SEC were Najee Harris (61.1%) and Clyde Edwards-Helaire (56.4%) with Etienne's clip right at the conference average.
With the soft schedule, Lawrence comes in with the second best Passing Success Rate among the playoff passers. His accuracy is top-level, but you don't need me to tell you that. Thanks to his overall passing and rushing efficiency and Dixon's ability to make the most of his chances on the ground, Clemson will come into the CFP with a 50.8% Overall Success Rate, which only trails LSU's clip.
Even though their Explosive Play Rate -- or percentage of plays that consist of runs that gain 10+ or passes that gain 20+ -- ranks third amongst the playoff contenders, they boast the best rate of plays that net 15 yards or more. On average, one out of every six snaps eclipses that mark. This is largely thanks to the potency of their ground game. On average, one out of five runs gains 10 or more yards. Only LSU's rushing attack has been more explosive against its highest rated foes.
Clemson does a very good job neutralizing fronts. Perhaps due to the tissue paper defenses they've faced, but no playoff offense has done a better job at limiting HAVOC plays than the Tigers. HAVOC plays basically are any play that is bad for an offense: TFLs, sacks, turnovers, deflections, etc. Plus, they have the second-best Negative Play Rate among the title contenders. Considering Lawrence was the worst of the playoff QBs when facing pressure essentially across the board versus his four hardest defensive opponents, it's a damn good thing they keep him upright more often than not. I wonder if that will deter Chase Young's spirit.
They rarely move backwards and tend to find themselves in manageable down and distance situations more times than not. This has facilitated their excellent Early Down Conversion Rate. There's a saying going around: the best 3rd Down offenses are offenses that don't play a lot of 3rd Downs. Since 3rd Down's are more volatile and unpredictable than other downs, it's not the most efficient strategy to bank winning on succeeding on the money down. No playoff offense converts more on 1st or 2nd Down chances than Clemson. Three out of Four early down plays on average result in moving the chains.
Despite the best Early Down Conversion Rate, Clemson's first team suffers from the highest Three-And-Out Rate of the four playoff offenses. Just under 18% of their drives against their premier foes have been such.
But that isn't to say they suck on the do or die down. Clemson shares the best 3rd Down Success Rate with Ohio State with a 54.6% clip among the playoff teams. Their first team has played the least amount of thirds against their quality opponents. The money down has been their most pass-happy, which is the case for most offenses. On their 44 3rd Downs, 34 passes have been called. Despite the proclivity to pass in these spots, Clemson sports the best 3rd Down Rushing Success Rate. When running the ball, they have moved the chains an astounding 90% of the time averaging just under 8 yards per carry. Their only failed try was a stuffed goalline carry against South Carolina.
Playoff Offense at a Glance *vs TAMU, UNC, SCar, and UVA | Overall Success Rate | Explosive Play Rate | TD Rate | TO Rate | HAVOC Rate Allowed | Negative Play Rate | Yards/Play | Pass Rate | RPO Rate |
| Clemson | 50.8% (2nd) | 16.1% (3rd) | 6.20% (4th) | 0.83% (2nd) | 21.5% (1st) | 7.85% (2nd) | 6.98 (3rd) | 56.6% (2nd) | 27.7% (1st) |
Their Favorite Plays
Even though Clemson passes the ball 57% of the time, their two most called concepts are run plays. Like their semifinal opponent Ohio State, Clemson leans on inside zone looks. Slam Reads and Bluff Reads make up over a quarter of their total calls against their top4 defenses faced. But perhaps due to a lax in level of competition or because of a more balanced carry distribution, the Tigers have been far more efficient running these than the Buckeyes.
Inside Zone Slam Reads and Bluff Reads are the only two run concepts among Clemson's most-repped looks. And when you see how good they are executing them, it is easy to understand why. Slam Reads have been successful on 56.3% of reps and Bluff Reads have met situational goals 69.2% of the time. Knowing that, you can see why Clemson owns top Rushing Success Rate among the four playoff teams.
Slam Reads and Bluff Reads are blocked and meshed the exact same but there is one key difference. Bluffs call for an offset TE/FB to shoot against the grain of the zone blocking and look to set an edge on the opposite side of the formation. In the read game, this blocker often morphs into a personal protector for the QB should he choose to keep the ball. Trevor Lawrence is a dangerous enough runner due to his size and athleticism, but when given a lead blocker on the edge, he has not disappointed in the slightest. As aforementioned, Lawrence comes in with a top5 Rushing Success Rate among playoff rushers.
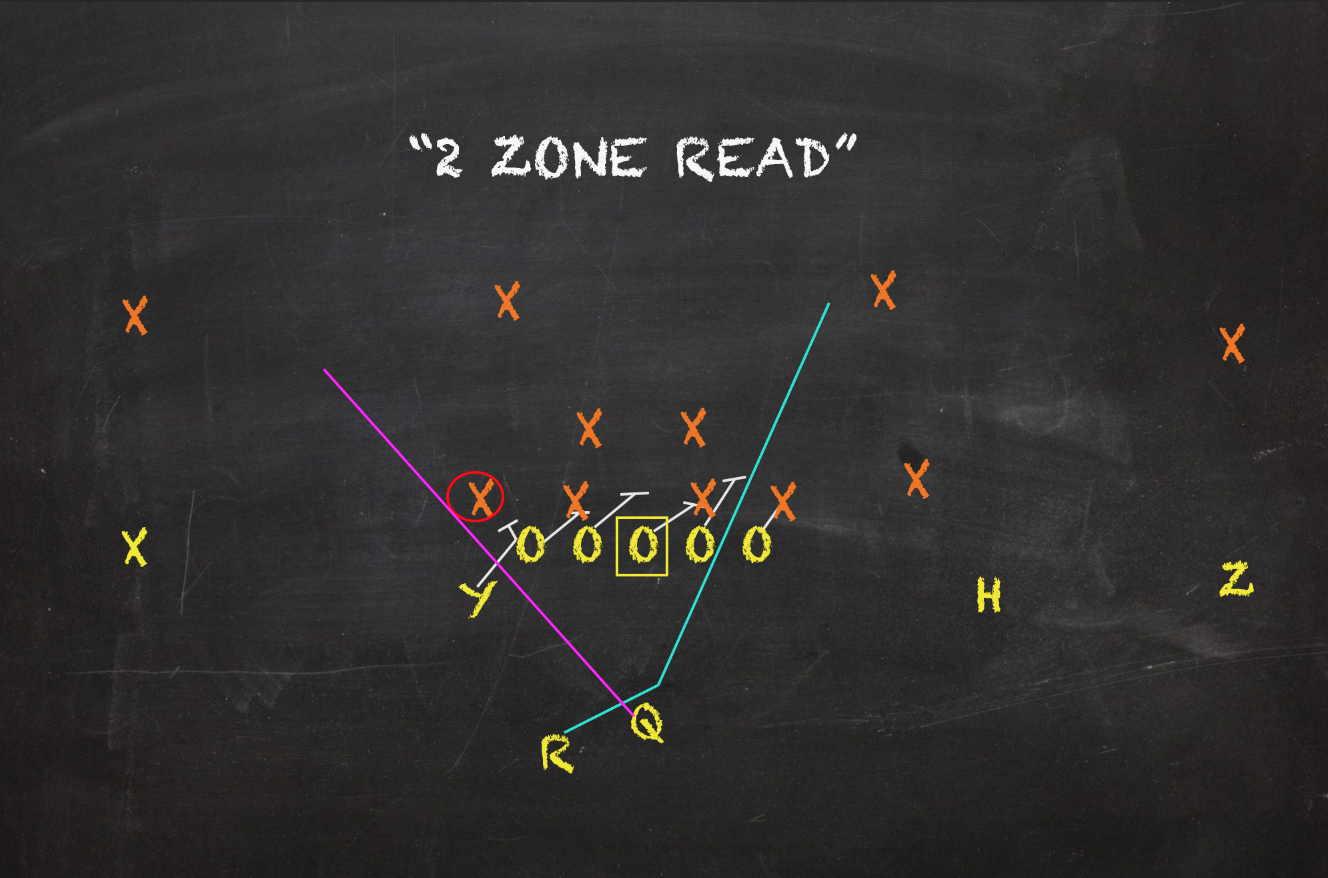
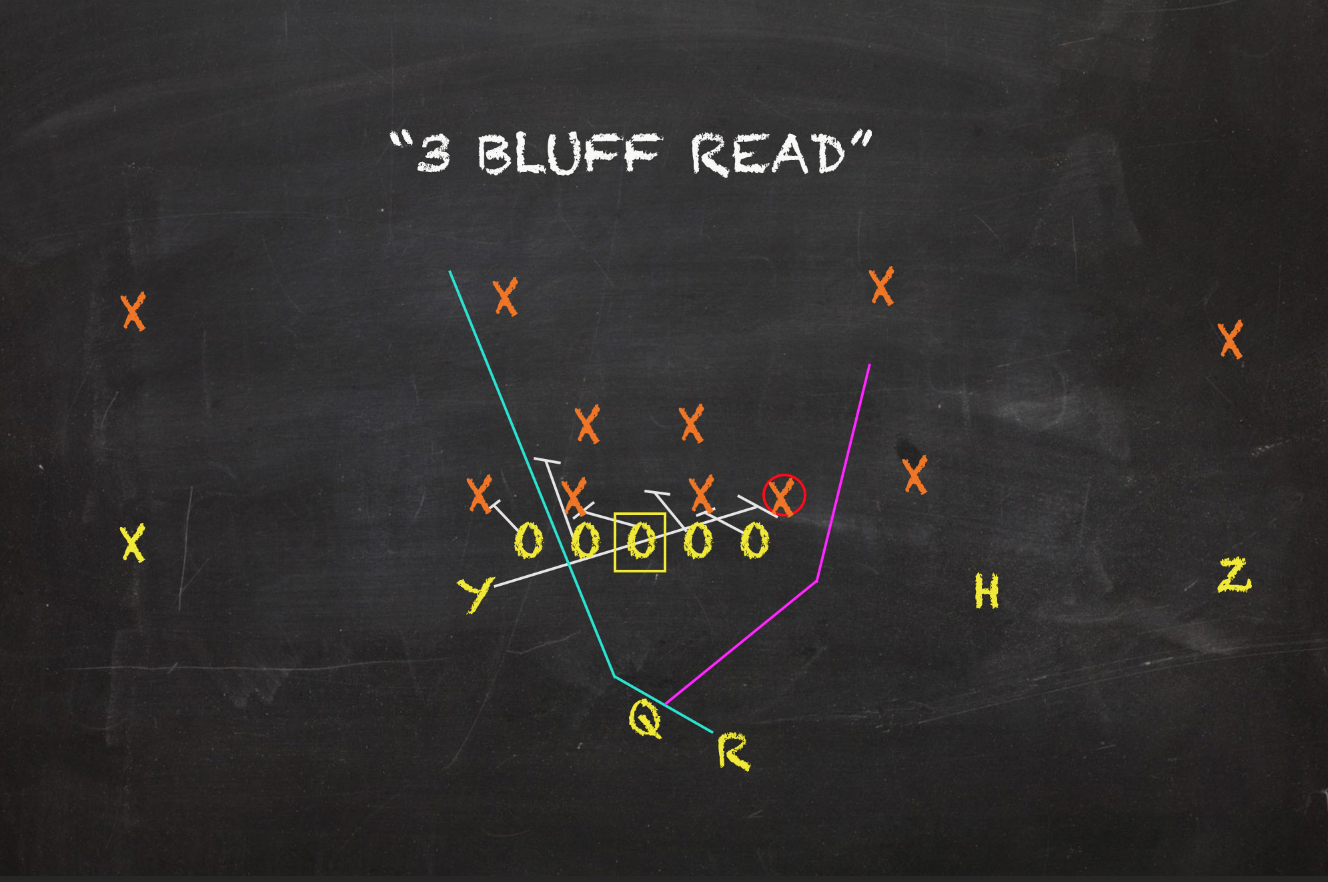
Thanks to abundant chances, both are among Clemson's top5 best concepts in terms of accumulating yards. Slam Reads have seized the most with 255. Keep in mind, this is only the first team's numbers. Garbage time plays serve no purpose in evaluating Trevor Lawrence and Co and were not charted. So, their overall volume numbers are less than their contemporaries because they sat out a couple of fourth quarters.
Clemson utilizes RPOs more than any other offense in the playoffs and over 17% of T-Law's attempts have occurred on them. RPO Outlet screens have gotten the third most reps of any look for the Tigers. But while the rush attempts on these looks have been sturdy and sound, they've largely left much to be desired in terms of production when Outlets have been targeted.
RPO Outlet screens sport a lowly 27.3% Success Rate averaging 3.72 yards per target. For a look that composes nearly 5% of playcalls, this shortcoming is a major blemish for an otherwise sterling offense. Pulling a read to target a Bubble Screen has been disastrous, especially. On six plays where Lawrence targeted a Bubble Screen, exactly zero have been situationally successful while averaging 1.7 yards per target in the process.
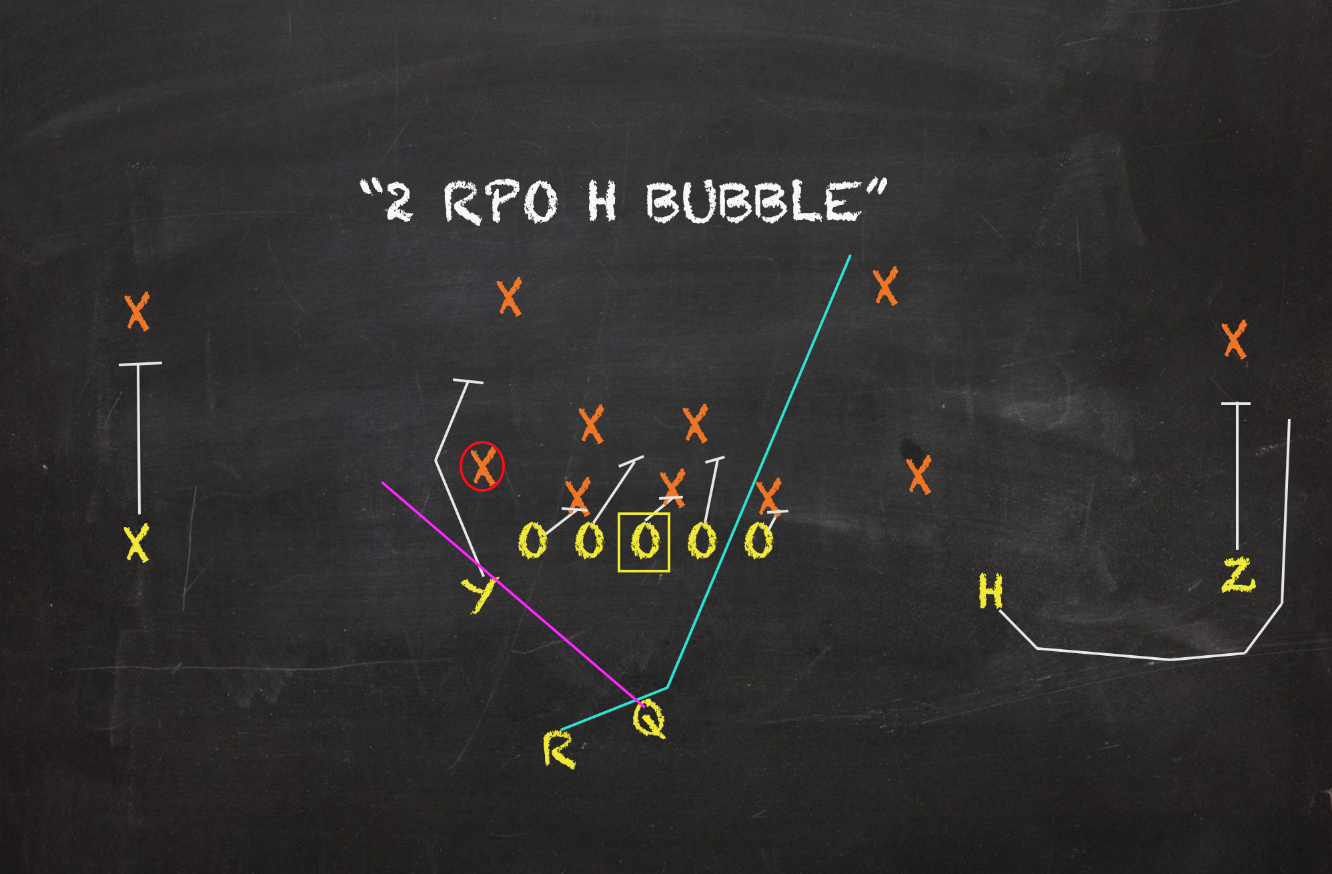
Other than RPO Outlet screens, Clemson also calls more True Screens than any other playoff team. True Screens compose over 4% of their calls against their premier competition. 10.5% of Lawrence's attempts have been directed towards screens. No other playoff passer has a Screen Rate over 5%. If all screen looks were to combined combined, they would be responsible for the fourth most yards of any concept versus their top4 defenses faced.
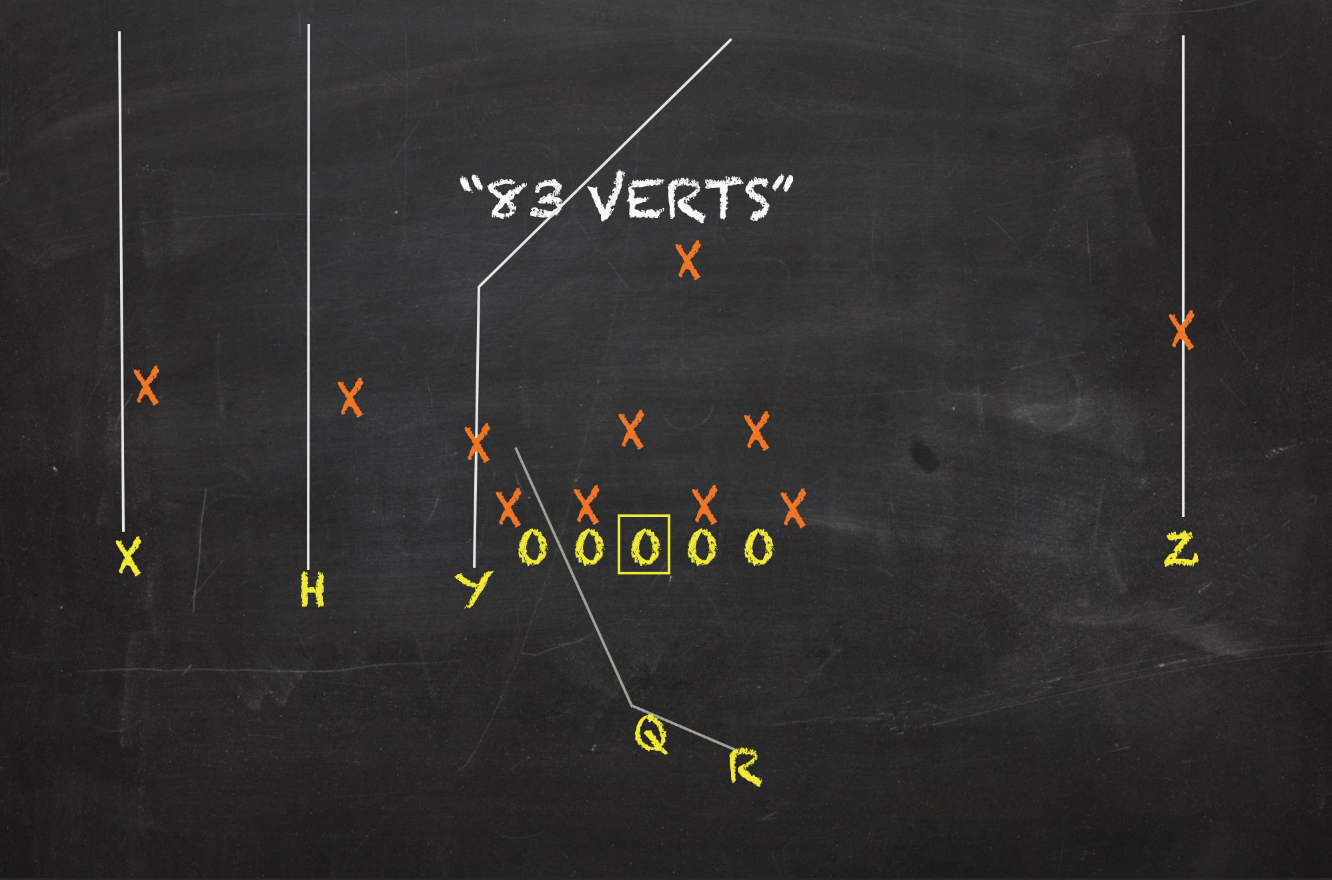
While their three most-called concepts might insinuate Clemson is a conservative, risk-adverse offense, three of their four favorite dropback pass plays aim to attack intermediate to deep parts of the field. Clemson is a team that loves All Verts. And they sure as hell should. In the games I scouted, Clemson was successful on 80% of the plays All Verts were targeted and averaged just under 20 yards per pop. Last year when this Lawrence was having his coming out party, his ability to connect on this pattern popped off the screen. Clemson torched not only Notre Dame but Nick Saban's Alabama defense as well by overloading the back half of coverages.
This potency is almost unheard of. Lawrence likes to deliver passes on a rope rather than putting air underneath them. These lasers are put in very strategic spots and often zoom past zone defenders. Lawrence is also an adequate backshoulder fade thrower. The eight All Vert connections are responsible for the second most yards for Clemson's first unit against its top-level opponents. Being so great on these plays have allowed Clemson to win the explosive play battle, which often can help turn ball games.
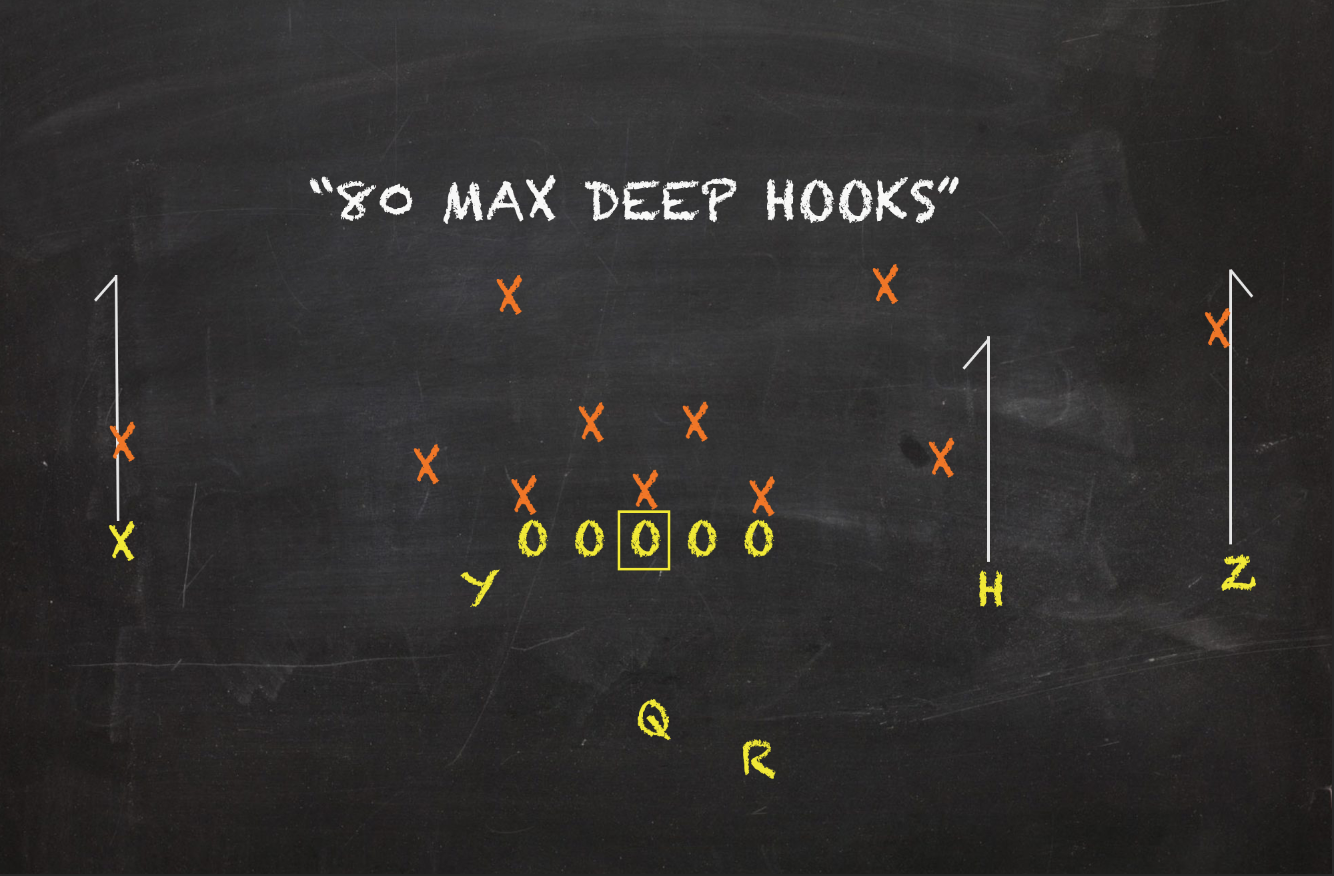
Naturally the more weary a secondary is to get beat deep, the more likely they are to sag off the line. Clemson smartly calls ample All Curl or Deep Hook patterns to be advantageous of the respect DBs give their wideouts. Used off heavy-set play fakes, RPO tags, or straight dropbacks, these have put up a smooth 78% Success Rate and average the same yards/target as Sails at 8.33. This "safe" design has accumulated 75 yards, which is tied for the fifth most amongst the concepts they've called against their top rated foes.
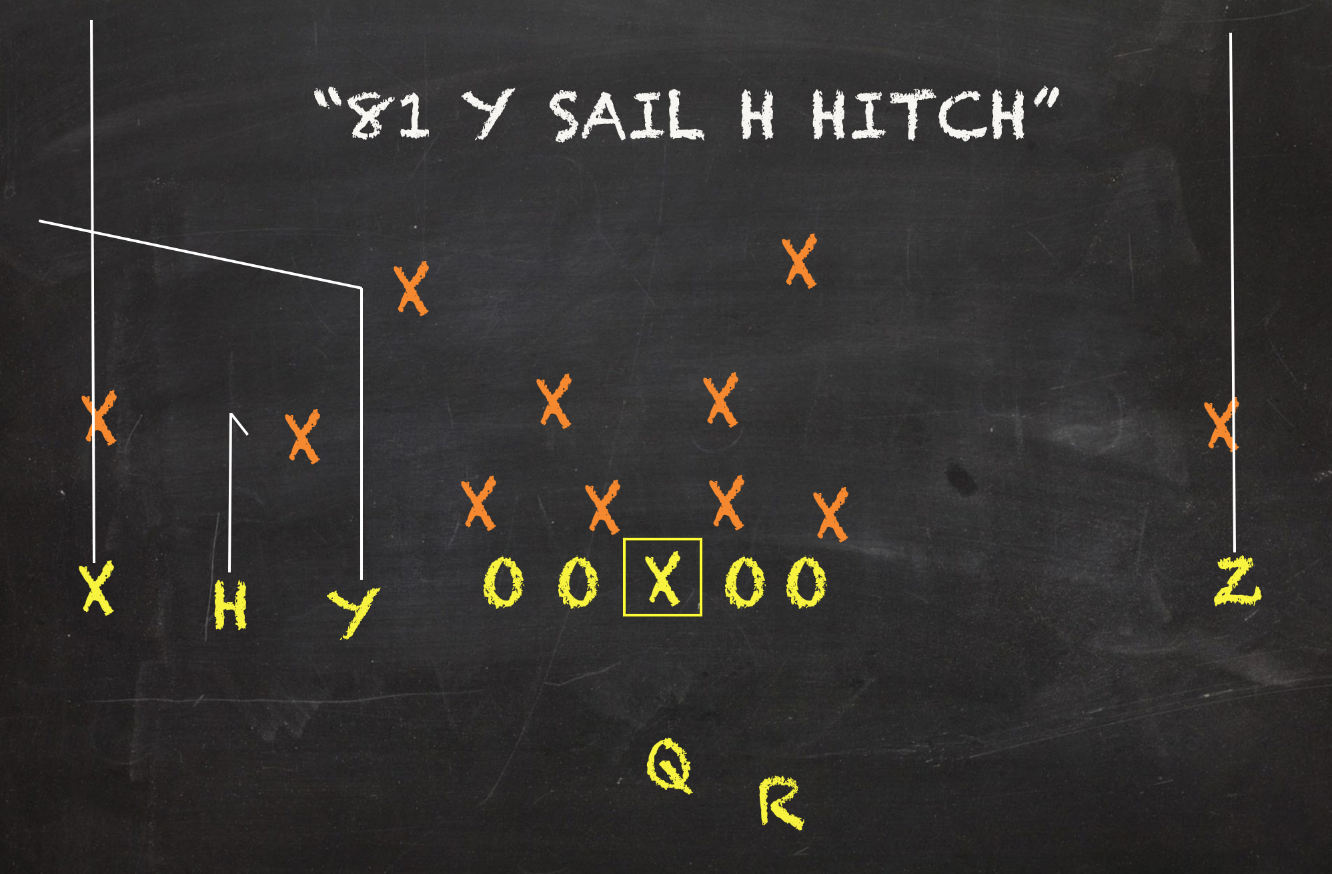
Sail Variations come next. Versus Texas A&M, UNC, South Carolina, and Virginia, the Tigers called a number of wrinkles off this strong flood design. They have called them off play action waggles, dialed them up with a slot hitch, and inverted the design so the outside receiver runs the out-breaking route (*NOTE: Normally this is reserved for the slot. But LSU also uses an rather unconventional sail design; see that piece for that). Sails have unfortunately returned the worst efficiency of their top dropback looks. These plays only sport a 44.4% Success Rate. It bears mentioning two of their successful reps were on a broken play heave for a score and a scramble for 21 yards.
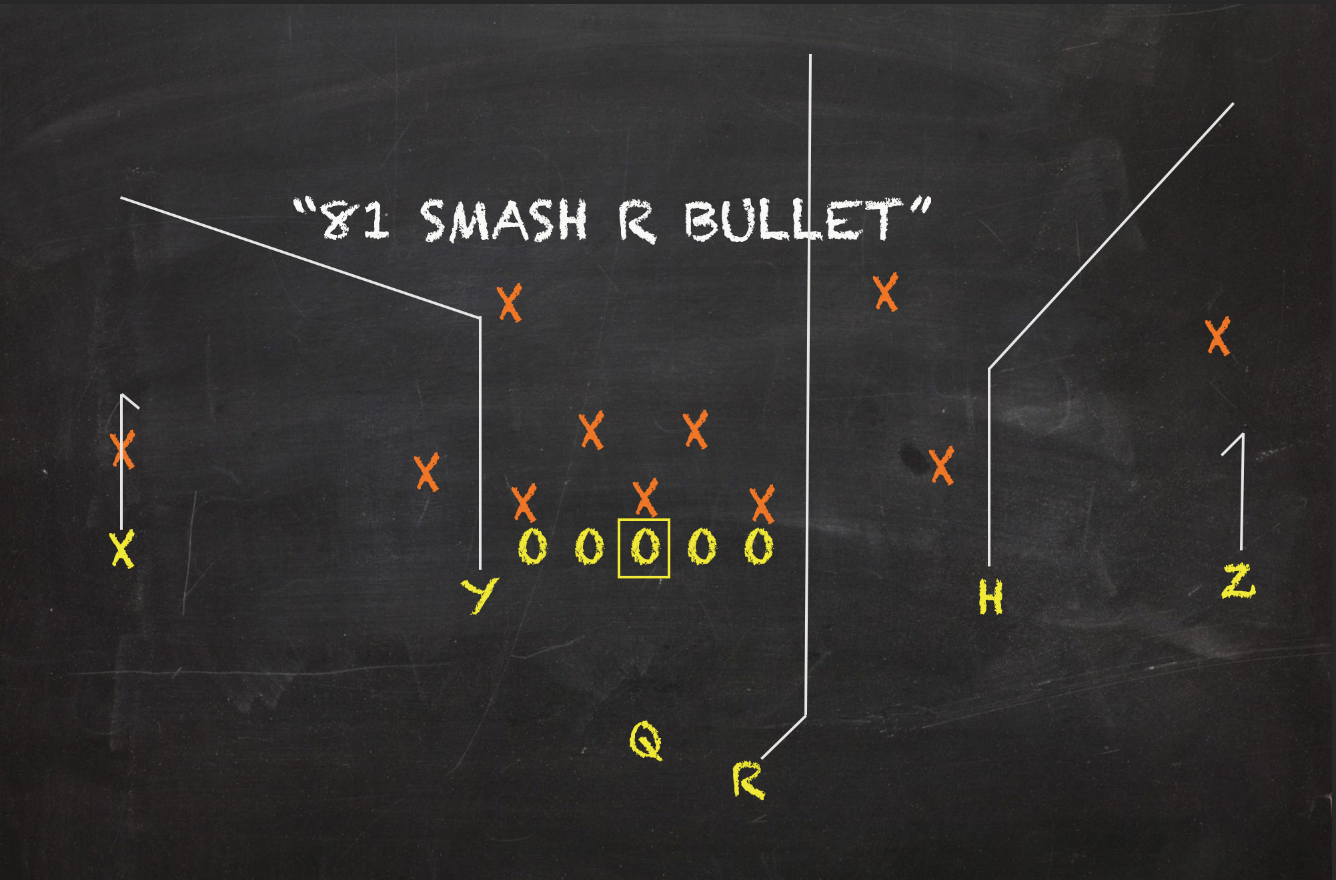
Clemson has gained 103 yards targeting Smashes, which is the third most of any concept. They've provided a steady and reliable intermediate design on later downs.
From the illustrations, you might be able to tell this offense aims to get north and south. All Verts and All Curls, Hoss/Comeback designs, Smashes, and Sails compliment each other nicely. The natural vertical nature of a go route and a curl make them almost indistinguishable before the receiver hitches up. Hoss/Comebacks borrow from this but still provide a downfield threat via middle seams. Smashes then allow middle receivers to toy with safeties expecting a path down the seam by breaking towards the sideline on a corner route. Sails provide a triple level hi-low read outside the numbers equipped to whip a number of zone coverages. While maybe not the most revolutionary of designs, Clemson's passing offense does an exceptional job keeping defenses off-balanced vertically.
While Inside Zone Slam and Bluff Reads are far and away the Tigers' two most beloved run plays, it is not out of the questions to see a Counter or two. These occasionally-featured misdirections in the read option game have delivered a robust 86% Success Rate on a 9 yards per carry average; non-read Counters have been middling (43% and 3.14). It's only natural for a straight forward zone scheme to have some sort of misdirection to deal with over-anxious backers. When Lawrence has been attached as a threat to run, their backs generally have had an easier go of it.
| Clemson's 7 Most Called Concepts | Play Share | Yards/Attempt | Success Rate |
| Inside Zone Slam Read | 19.8% | 5.31 | 56.3% |
| Inside Zone Bluff Read | 5.37% | 6.38 | 69.2% |
| RPO Outlet Screens | 4.55% | 3.72 | 27.3% |
| All Verts | 4.13% | 19.8 | 80.0% |
| All Curl | 3.72% | 8.33 | 77.8% |
| Sail | 3.72% | 8.33 | 44.4% |
| Smash | 3.72% | 11.4 | 55.6% |
| Clemson's Top 6 Yard-Gaining Concepts | Total Yards | Yards/Attempt | Success Rate |
| Inside Zone Slam Reads | 255 | 5.31 | 56.3% |
| All Verts | 198 | 19.8 | 80% |
| Smash | 103 | 11.4 | 55.6% |
| Hoss/Comebacks | 97 | 19.4 | 60% |
| Inside Zone Bluff Reads | 83 | 6.38 | 69.3% |
| Sail | 75 | 8.33 | 44.4 |
| All Curls | 75 | 8.33 | 77.8% |
1st Down Offense
First downs often help one get a pretty good idea of what an offense is and how it likes to operate. Since first downs get more chances than any other down, they naturally reflect looks offenses like to utilized the most when their playbook is wide open. Odds are if a team is bad at managing down and distance on firsts, their degree of difficulties on the subsequent downs will likely be higher which generally leads to a lower rate of success.
Clemson is an exception to this rule of thumb. Despite being a lesser team to start a set of downs, their overall numbers are still solid. Though they aren't as bad as Ohio State in these spots, Clemson is far from its usual self on firsts. Like in general, Clemson is the second most pass-happy offense in the playoff on 1st Downs. Still, the majority of their plays to start a set of downs are runs. Because a number of concepts' Success Rates have dipped in these instances, the Tigers rank third amongst playoff contenders on firsts in this regard. However if their 47.1% 1st Down Success Rate against top rated opponents was averaged across the whole season, it still would have been the third best in the SEC.
Both of Clemson's core run plays average more yards per play on firsts but are far less consistent situationally. Clemson's first team had 63 called first down runs in the four games against its premier foes. Inside Zone Slam Reads are represented the most in their script. They get called almost 4x more than the next closest concept to start a set of downs. Slam Reads' Overall Success Rate is about 12 percentage points higher than it's clip on firsts. So with their volume and lackluster results, it's easy to see why Clemson's stats on 1st Downs look dented. Bluff Reads, however, are even less efficient. Their Success Rate is nearly 27 percentage points worse than its overall clip. By SEC standards, that's average AF.
RPO Outlet Screens are next in the pecking order. Like the zone runs from which these route tags are attached, Outlets have largely disappointed when targeted. Already a look that has sour numbers overall, only one of its six reps has been successful while averaging 1.67 yards per target. Meant to compliment the Tigers' core zones, these fail to accomplish their goal of winning in space and creating horizontal stress on defenses.
Counter Reads have been a nice change-of-pace look to compliment Slam and Bluffs. Six of this play's seven reps have occurred on firsts. Four of them have met situational goals by averaging 9.5 yards per pop in the process. With only two major zone runs commanding the script, a misdirection often can take advantage of fronts and backers who are anticipating a certain kind of action. The down blocks and hard edges initially look like a zone before a backside puller sets a hard edge to create the run lane opposite it.
Outside of those looks, Clemson likes to be cagey and offer up a cavalcade of concepts to keep defenses unawares and constantly guessing.
All Curls and Deep Hooks out of spread formations and off play action have been great for Clemson on firsts. I already touched on why above. But 80% of these patters have been successful when targeted on 1st Downs. While a rather small sample size, Clemson has executed these plays crisply.
Nine other concepts have gotten either three or four first down reps against their top rated defenses faced. While aforementioned looks like All Verts, Sails, and non-read Counters are to be expected on the most common down, others like Curl+Flat combos, Buck Sweep Reads, Outside Zone Reads, Off-Tackles, and isolated out route "Omahas" appear from time to time.
First downs is where Dabo likes to get a little frisky. Other than All Verts, Clemson has dialed up four Switch plays, two Reverse Passes, two Fades, a Double Post pattern, a Fake Screen, a Deep Double Move, a Portland Shot, and a Flea Flicker on first downs across the four games against its hardest competition. While most have failed to be successful, Vertical and Scissor Switches, the Double Post and a Fade pattern have. Either by hard-set play fakes, multiple actions from motions, or testing secondaries, Clemson uses first down to be rather aggressive when it's not satisfied marching down the field with its most favorite plays.
The vast majority of the time, Clemson slams a back into the defense with its zones to stay ahead of the chains. But when they aren't focused on setting up manageable down and distance situations, the Tigers are gunning for explosive plays downfield with a diverse variety of vertical oriented patterns or trick plays.
| Clemson's Top 5 Most Called First Down Plays | No. of Reps | Yards/Attempt | Success Rate |
| Inside Zone Slam Read | 27 | 5.56 | 44.4% |
| Inside Zone Bluff Read | 7 | 6.43 | 42.9% |
| RPO Outlet Screen | 6 | 9.50 | 66.7% |
| Counter Read | 6 | 1.67 | 16.7% |
| All Curls | 5 | 8.60 | 80.0% |
3rd Down Offense
Offense on the money down is often more unpredictable, variable and correlated to victory than any other down. While 1st downs do a damn good job illustrating what an offense is, 3rd Downs show us its true colors.
While Clemson's efficiency is at its worse on 1st Downs, Clemson is one of the best on 3rd Downs. While the Tigers' cumulative 3rd Down Conversion Rate is in the mid 40's, against its four hardest opponents its damn near 55%. Their clip is the exact same as Ohio State's, which already forebodes how crucial this down will be when the two clash.
But with their great Early Down Conversion Rate and by playing less series due to sitting starters in blowouts, Clemson's first team has played the fewest 3rd Downs than any playoff offense. While Ohio State leans on Slam Reads regardless of the down, Clemson prefers to be balanced and to not tip their hand on the money down. Eleven different concepts have received between two or four reps in these instances. Talk about being unpredictable.
Of those 11 looks, only three of them are runs. But all three of them sport 100% Success Rates. Like I mentioned above, Clemson has had only one failed 3rd Down carry against the best defenses they have faced, which was a botched goalline try. Slam Reads and Bluff Reads are of course two of them. The other is a Stretch Option that aims for Lawrence to attack the edge of the formation with his athleticism. While most of Clemson's run game is directed inside, outside oriented runs like these have been overly successful for the Tigers.
Clemson is the most pass-happy team on third downs in the playoffs from the games I've charted. Pivots and Smashes lead the way in number of calls. Plus, Clemson has paired the concepts together in the same play design a couple of times. Regardless of what each has been paired with, each concept has moved the chains half the time when targeted.
The only other pass play with more than two reps on 3rd Downs against their top rated foes have been Sails. However, both successful reps occurred in the game versus Texas A&M in Week 2. And one of them was the product of playing backyard ball once the play broke down due to pressure.
The Inverted Smash design "Corners", Fade+Slant Rubs, Deep Fades, Hoss/Comebacks, and Daggers are the other plays with at least two 3rd Down chances. But on such a small and limited sample size, evaluating individual concepts on this down is often a futile affair.
With no clear cut go-to look on the money down, defensive coordinators are left to gamble and guess. And as Clemson's magnificent Success Rate suggests, they've done a bad job pinning the Tigers on this down thus far.
| Clemson's Top 4 Most Called Third Down Plays | No. of Reps | Yards/Attempt | Success Rate |
| Inside Zone Slam Read | 4 | 5.50 | 100% |
| Pivot | 4 | 4.00 | 50% |
| Smash | 4 | 13.3 | 50% |
| Sail | 3 | 14.7 | 66.7% |
| *** 7 Concepts tied with 2 reps | 2 | N/A | N/A |