Sideline to Sideline: CFP Oklahoma
For this special edition series of Sideline to Sideline revolving around the 2019 College Football Playoff, SEC Statcat is tweaking it's normal structure. Instead of doing one, big long article chocked full of the advanced analytics, playcall trends, and stat nuggets you know and love, we will be presenting a number of articles geared around all three playoff games. The Sideline to Sideline pieces will consist of deep dives on each playoff offense as well as breakout articles examining certain aspects of all four teams like their quarterbacks, schedule, and offensive weapons to mention a few.
Instead of evaluating each team by their entire body of work, SEC Statcat charted each of the title contender's four best defenses faced per ESPN's SP+ metric. To be concise, this is the Worldwide Leader's blanket stat that measures potency, explosiveness, scoring, and down-to-down success relative to their opponent, field position, and a few other factors. But, I will bring this metric up from time-to-time, so keep in mind what it is.
Sure, each of these schools have varying degrees of difficulty in terms of the teams they have faced. But by looking at their "four hardest games", we're able to get a better depiction of what to expect from these guys in the playoff.
Another buzz term I will be using in great volume is "Success Rate". All yards aren't created equal, and Success Rate applies situational conditions that need to be met in order for a play to be "successful". In case you are unaware, a successful play must gain 50% of yards to gain on 1st Downs, 70% of yards to gain on 2nd Downs, and 100% of yards to gain on 3rd/4th Down.
I talk about X's and O's in terms of concepts quite often. To help educate the less savvy fan, the majority of the ones mentioned in these pieces have yellow hyperlinks to "Gridiron 101" tutorials that explain them in further detail in a quick video.
In this piece, SEC Statcat will be analyzing the Oklahoma Sooners. Their four toughest defenses they've faced per ESPN's SP+ are Kansas State, Iowa State, TCU, and Baylor. But I went a little rogue for this article and swapped TCU out for Oklahoma State. I figured seeing their game plan against a top25 rival on the road would be more worthwhile. So keep in mind, the figures below come from charting the Sooners versus Kansas State, Iowa State, Oklahoma State, and Baylor in the Big 12 Championship.
Oklahoma's Offense at a glance:
The general consensus entering the College Football Playoff is that Oklahoma is the longshot underdog. Vegas has agreed with the public's perception of this exciting, yet flawed Sooner squad. Per Bovada.lv, Oklahoma's odds are currently +1000 -- about 5x greater than the two and three seeds' chances.
While Lincoln Riley's offense has continued to put up video game numbers and further the wunderkind's resume as an offensive mastermind, a so-so defense and close games versus conference opponents have caused many to dismiss Oklahoma even before they arrive to Atlanta. While LSU and Ohio State each boast clear-cut resumes and have beaten a handful of quality opponents, Oklahoma's slate has been riddled with one-dimensional teams. Their competition this year has either been good at offense or defense, but not both. This has muddled scouting them a bit. Sure they beat Texas, Oklahoma State, and Top10 Baylor twice. But, each of their games versus their top4 hardest opponents per ESPN's SP+ have been one score margins (*NOTE: TCU holds a better SP+ Defensive Rating than OK State despite the Pokes being included among Oklahoma's "four hardest" figures). Perhaps not as tested in terms of strength of opponents, they're well-experienced in finding ways to win in close contests this season. All else considered, only Clemson has had an easier go of it in terms of scheduling. And there's a considerable margin from theirs and the top2 seeds as far as ESPN's SP+ metric is concerned.
While I won't be touching on their defense, their offense is good enough to win any given one-game sample. You don't need me to tell you that. I mean after all, this offense owns the nation's 2nd best total offense and the 5th best scoring offense. College football fans have gotten spoiled expecting this kind of output from the Sooners year-in and year-out under Lincoln Riley. Essentially most assume they'll produce gaudy stats no matter what. And Riley's offenses keep delivering.
With three straight years of playoff births coinciding with three straight Heisman finalists, Oklahoma is among the top brands in the game. But failing to win in the playoffs continues to keep them a step below the other top dogs in college football.
Despite being one of the most proficient point scorers in the country, Oklahoma is the weakest playoff team in terms of "Relative Scoring Offense".This translates to how much better an offense scores on average compared to what it's competition allows. For example: Team A scored 28 points against Team B who usually allows 14. Team A's RSO would then be 200% (28/14 x 100).
Even with half of their opponents this season having defenses described by professionals as "f*cking awful", Oklahoma just hasn't beaten these lesser schools as badly as the other title contenders. Over their entire schedule, the Sooners' Relative Scoring Offense is 154.4%, which is about nine percentage points lower than the next closest playoff team. While absolute victories, they've been less impressive than the others.
But when we examine their RSO versus the meat of their schedule, the Sooners see a slight uptick to 157.9%. Among the playoff teams, this is the third best behind LSU's and Ohio State's clip. So while their RSO was so-so against the cupcakes on their slate, Oklahoma's offense performed better against their top rated foes. That's a good spin for the Sooners. Plus, each of their five toughest games per the SP+ came over the back half of their schedule. Since these games are more recent, they are more relevant to prognosticators, bettors, and statisticians alike.
No playoff offense is more balanced than the Sooners. The reason is two-fold. First, Oklahoma's Run/Pass Ratio in the four games I charted is 51/49. No other playoff offense gives equal weight to both running and passing. The others have obvious preferences one way or another in that regard. The next "most balanced team" has a Run/Pass Ratio of 57/43.
By being balanced in this manner, defenses are kept on edge. Most defensive coordinators will tell you, the hardest offenses to prepare for are the ones where you don't know what to expect next. With an even tilt between running and passing the ball, the Sooners yearn to play complimentary football. Further maximizing this balance, Jalen Hurts uses more play action than any other playoff passer on average. Just under 30% of this attempts have been off play fakes.
Secondly, Oklahoma has the most well-distributed and diverse script of the four playoff offenses. It's one thing to balance out runs and passes, but it's another to dial up a multitude of concepts on the reg. Most offenses like to key in on five or six looks for the most part. While certainly more than that appear on play sheets over the course of a game, offenses have clear favorites and go-to looks. Oklahoma prefers variety in this regard.
Sure, Oklahoma has a staple concept that gets more calls than others, but the gap between favorite looks isn't as prominent in regards to play share. Most units see major dropoffs in terms of volume from its first to second most called looks as well as its second to third. Yet, Oklahoma's top three most called plays are only separated by 4%.
Their 4th and 11th most called looks are separated by the same margin. Calling games in this manner, as you can image, stresses the hell out of defensive coordinators. Attempting to pinpoint that many concepts regularly is like rolling a pair of dice trying to predict what comes up on each die. Most of the variety in this regard is thanks to their run game. Most offenses prefer to lean on two or three looks on the ground consistently. But this is another trend Oklahoma's offense has bucked. Seven of the Sooners' 11 most called plays are runs.
In the games I have charted, Oklahoma's offense owns the third best Overall Success Rate of the four playoff teams. If averaged over the course of the season, their 47.8% clip would only trail LSU's and Alabama's Success Rates within the SEC. Oklahoma's 48.1% Rushing Success Rate is second to only Clemson's versus their top rated foes. When airing it out, they have been successful 47.6% of the time. So even in terms of Success Rate, the Sooners run and pass games carry equal weight overall. While both clips are serviceable, a high number of turnovers, sacks, negative plays, and broken plays are seen from this unit, which obviously, hinder Oklahoma's overall efficiency.
HAVOC plays -- basically anything bad for an offense -- are a constant threat to the Sooners. Perhaps because of Hurts' playing style or subpar line play, Oklahoma suffers from the highest HAVOC Rate Allowed of the title contenders. Just under 33% of their plays suffer from HAVOC. No one else has a clip north of 26%.
While good at executing on early downs, Oklahoma has the worst 3rd Down Success Rate in the games I charted of the four playoff teams. On the year, over half of their 3rd Down tries have resulted in moving the chains. But against their four hardest foes, that clip drops to 46%. No other playoff offense has a 3rd Down Success Rate under 51%.
While down-to-down consistency against their top rated foes doesn't jump off the page, no other playoff offense is as explosive as the Sooners. While our eyes have informed us of their homerun ability, we have numbers that confirm their potential to explode down the field on any given snap. Versus Kansas State, Iowa State, Oklahoma State, and Baylor in the Big12 Championship, over 17% of Oklahoma's plays resulted in an explosive gain (NOTE: In order for a play to be considered explosive, it has to be a run than gains 10+ yards or a pass that gains 20+) .This potency has often helped negate suffered HAVOC plays.
No offense averaged more yards/pass or number of passes that went for 20 or more yards against the meat of their schedule than Riley's Sooners. While no other playoff team averages more than 7.9 yards/pass, Oklahoma's clip is 9.1. Their Explosive Pass Rate is 4 percentage points more than the next best playoff team.
While these explosive plays might not always lead to touchdowns, no other playoff offense has a higher percentage of drives result in points than the Sooners. Remember, their Relative Scoring Offense is one of the weaker clips of the four title contenders, but this unit still averages the 5th most points per game in the country. Just under 57% of their drives in the games I charted ended in points.
Playoff Offense at a Glance *vs Kansas St, Iowa St, Oklahoma St, and Baylor | Overall Success Rate | Explosive Play Rate | TD Rate | TO Rate | HAVOC Rate Allowed | Negative Play Rate | Yards/Play | Pass Rate | RPO Rate |
| Oklahoma | 47.8% (3rd) | 17.4% (1st) | 6.72% (2nd) | 1.98% (3rd) | 32.8% (4th) | 10.7% (4th) | 7.43 (1st) | 49.0% (2nd) | 19.8% (3rd) |
Their Favorite Plays
The Inside Zone Slam Read is by far the most popular play for the majority of college offenses. Looking around at our title contenders, no other look received more reps for LSU, Ohio State, or Clemson in the games versus their most challenging opponents than Slam Reads. Oklahoma, however, is part of that renegade minority where a power run play dons its highest play share. Even though they have a well-distributed script, Tackle Counter Reads are the foundational look for Oklahoma's offense.
There are many ways to run Counters. Since these plays are one of the oldest plays in the game, they have seen many renditions over the years. In fact, the Sooners give regular reps to two other types of Counters other than Tackle Counters. And if I'm being really nit-picky, Oklahoma has shown three variants of Tackle Counters. Other than their go-to design that pulls the backside tackle and guard -- aka Counter Treys or TAG Counters -- the Sooners have showed wrinkles with only a tackle pulling as well as TAG Counters where the quarterback and running back swap run paths. But, there's no denying traditional TAG Counter Reads are their favorite. For a LSU defense that was schooled by Ole Miss on a number of these wrinkles, Dave Aranda will certainly be keen on curbing these looks.
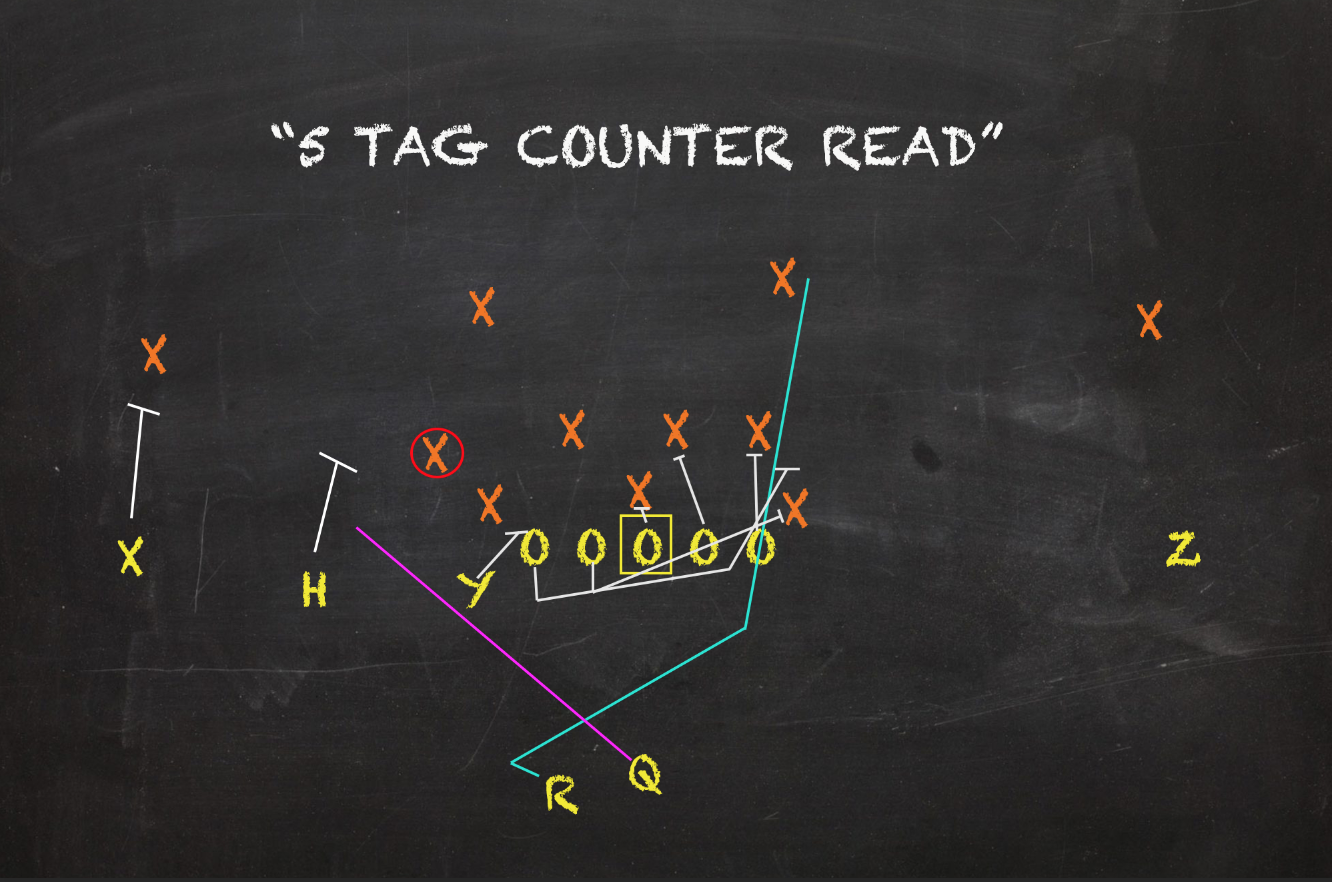
Overall, Tackle Counter Reads make up 11.5% of their offensive play calls. Not one of their playoff contemporaries have a power run concept own over a 8.3% play share. While LSU, Ohio, State, and Clemson have put up better Success Rates executing other run looks, none can top Oklahoma's Tackle Counter Read's 8.72 yards/attempt average. The next closest that owns at least a 3% play share is LSU's Duo Dive at 6.78. Against their four toughest opponents, 11 of the 29 Tackle Counter Reps resulted in either a first down conversion or a touchdown (38%).
The big play threat of Tackle Counters exists beyond their primary purpose. No playoff offense uses play action more than Oklahoma. Two-thirds of their play fakes call for at least one pulling lineman to help sell the power action. The Sooners often feast by sending targets on intermediate or deep routes through the vacated voids created by linebackers and safeties barreling towards the line of scrimmage looking to limit their Tackle Counters. Pitch and catch.
As you might suspect, Tackle Counter Reads have accumulated more yards than any other concept for Oklahoma over the four games I charted. Their 253 is almost 100 yards more than the next closest concept.
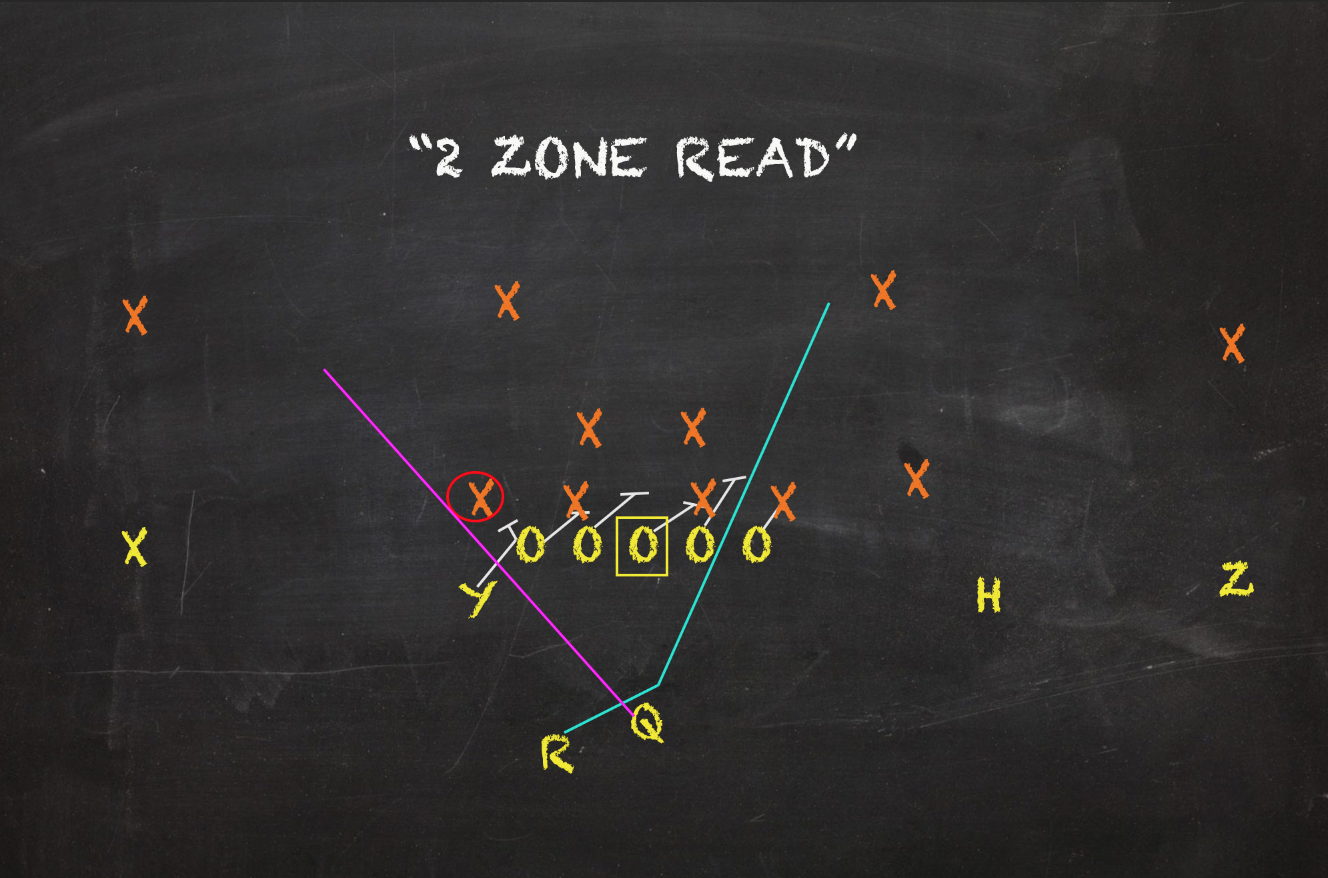
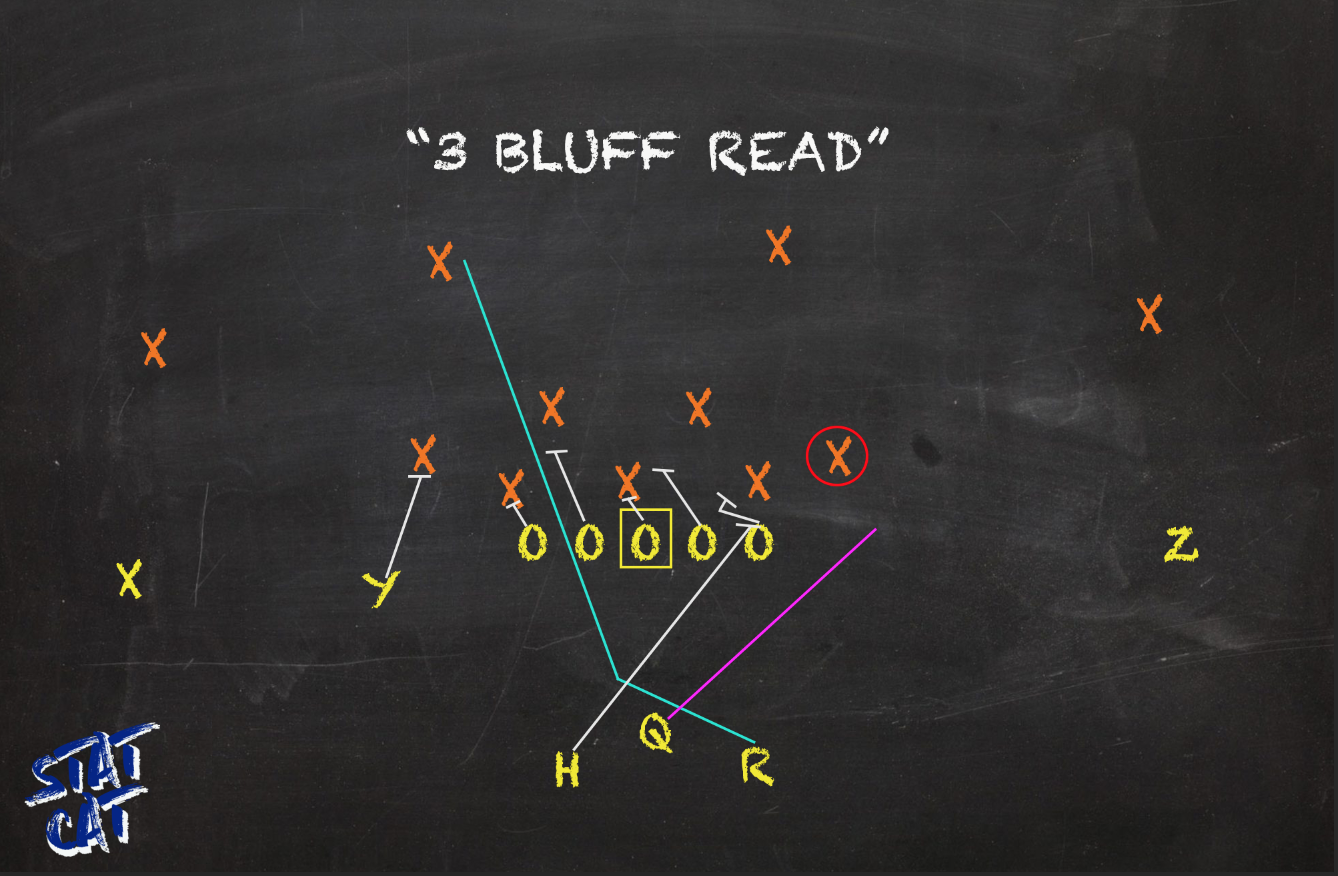
Their next two most called looks are Inside Zone Slam and Bluff Reads. As I hinted above, a good deal of offenses use these zones as focal points for their entire attack. Since Oklahoma loves misdirection elements, it's crucial to show a number of different looks. Slam Reads are called out of the same formations as their Tackle Counter Reads for the most part. But Riley's offense really likes to call their bluff stuff out of two-back sets. Doing so prevents the defense from being 100% sure which side of the line of scrimmage the zone action will go.
Slam Reads slightly have gotten more reps than Bluffs. But Bluffs have delivered better results. Like a lot of the offenses I have covered this season, the Bluff Read is this unit's most successful run concept. Of the Sooners four main run concepts, this is the only one with a Success Rate north of 50% -- Bluff Reads have been successful on 57.9% of their reps. Slam Reads numbers are slanted due to their disastrous returns on 2nd Downs, but they still aren't anything to boast about in other spots. Overall, they have a 45.5% Success Rate and only average 2.95 yards/attempt.
These two plays are basically the same play but with one major difference. Bluffs usually call for an offset TE/FB will shoot against the grain of the normal zone flow and look to set an edge on the opposite side of the formation. In the read game, this blocker often morphs into a personal protector for the QB should they choose to keep the ball after they make their read. In thee case of the Sooner's two-back sets, the back not involved in the mesh with the QB will take on the blocking role normally held by that offset player. By forcing more pressure on both sides of center for backers, stress can naturally cause larger run lanes the more they over-pursue one way or another. Not to mention, I'm sure QBs are far more comfortable pulling the ball when they have their own designated blocker. Bluff Reads have accounted for 86 yards over the four games I charted for Oklahoma, which was the fourth most of any concept.
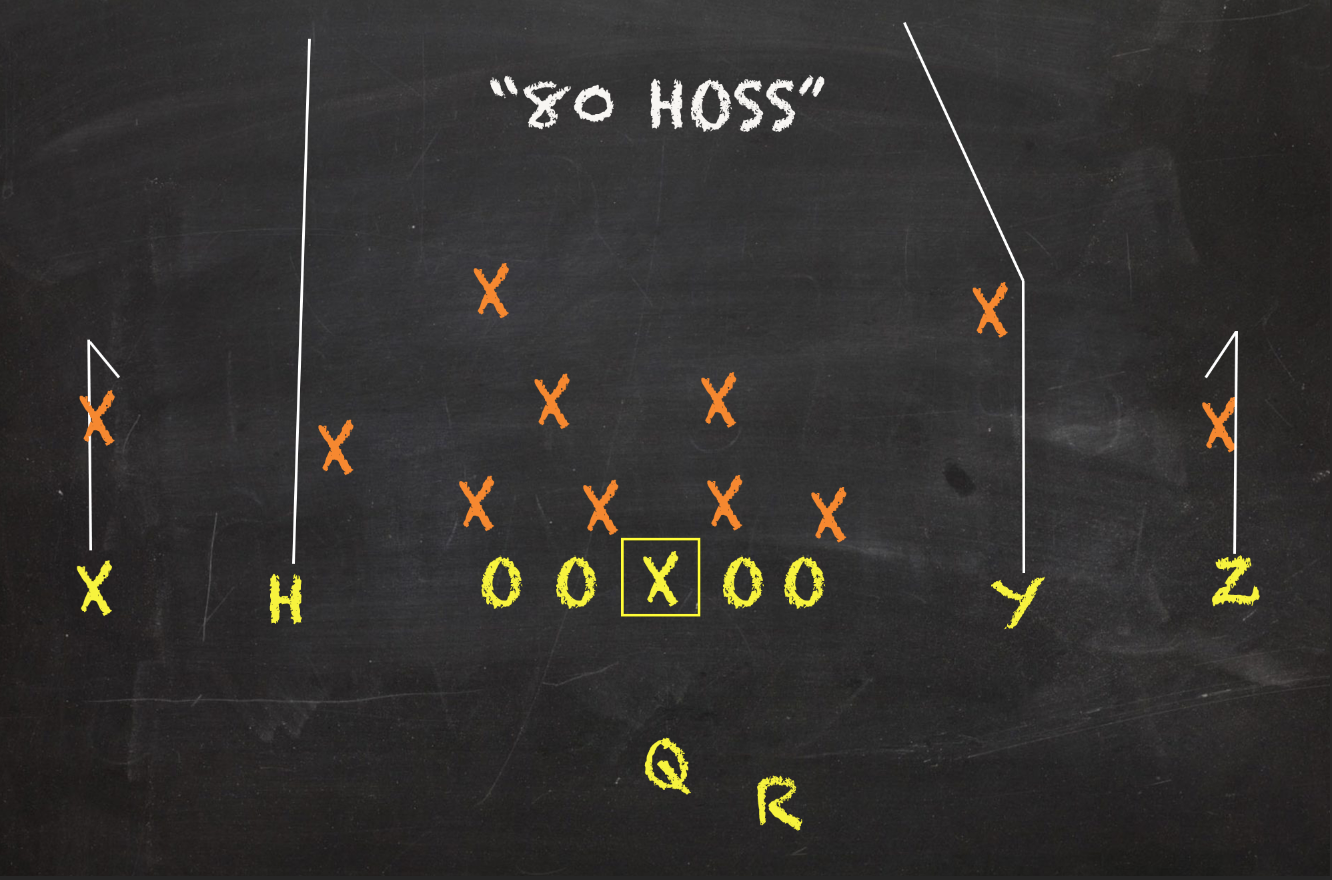
While their execution have been iffy, Seam+Sideline pass combos like Hoss and Comebacks combine to be the Sooners most called look through the air. Just under 6% of their play calls have targeted these concepts. By SEC standards, Oklahoma's production on these looks would be well above average. Hoss/Comebacks plays averaged 10.3 yards/target on a 46.7% Success Rate in the games I charted. In terms of gaining yards, these designs have gained the third most with 155.
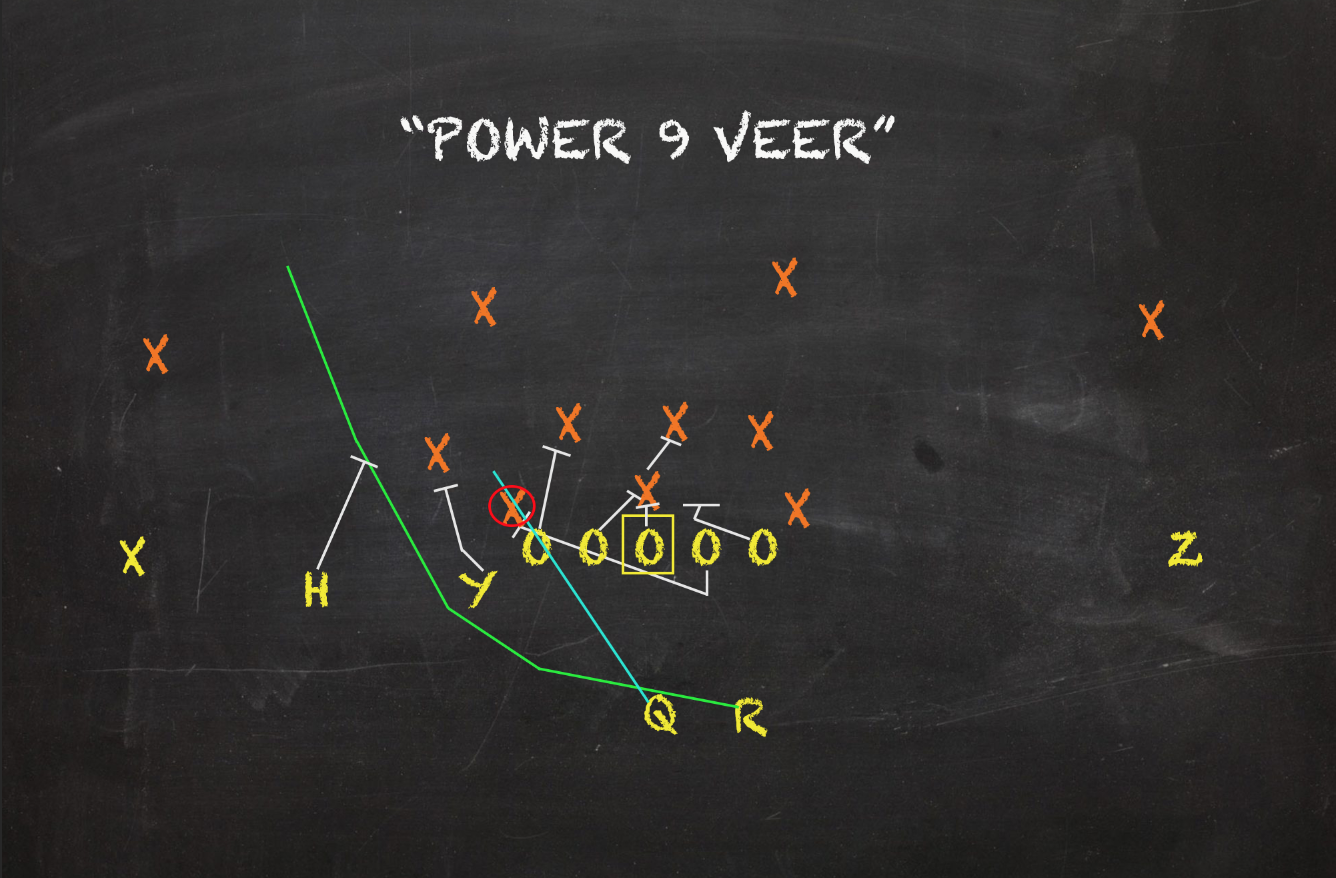
The Inverted Power Veer rounds out the Sooners' top5 most called looks. Though they have fueled a few explosive carries, Power Veers are Oklahoma's least successful run play that receives regular carries. Unlike the previously mentioned read option looks where the QB's and RB's run paths are on opposite sides of the center, Veers call for both to head the same way. But on Veers, the QB will be the north-and-south runner attacking the power run action with the back heading towards the edge. Though these add another look for the defense to worry about in the power read option game, Oklahoma didn't execute them consistently against their four hardest opponents. Power Veers have only been successful on 38.5% of their tries.
Like I aforementioned, Lincoln Riley loves to balance out his play sheet with a wide variety of concepts. Since one play doesn't really command a vast majority of their reps, Riley is able to spread the wealth around, which naturally makes their script more diverse. After their top5 most call plays, seven concepts have received between seven and nine reps.These sporadic looks that you might see once or twice a game include Meshes, QB Counters, All Verts, Keeper Counters, QB Draw RPOs, Outside Zone Read and Portland Shots.
Meshes -- or intersecting shallow crosses -- are often paired with Double Digs or with a combo known as the Dagger concept. The exact combination can vary due to formation and situation. When targeted, meshes have been successful on 55.6% of reps and have averaged 8.33 yards per pop. Daggers by themselves have accounted for the second most yards of any concept with 159. If we include Double Digs, an additional 45 yards would be tacked on. If I didn't have to compartmentalize which concept was targeted, these play designs are without question their favorite when dropping back.
Oklahoma gives Jalen Hurts a decent amount of designed runs. QB Counters and QB Draws with rudimentary RPO tags attached have been the Sooners preferred way to get him involved. While the former has been rather average, Hurts has executed his Draw chances quite well. QB Counters met situational goals 44.4% of the time with Draws being successful on 62.5% of tries.
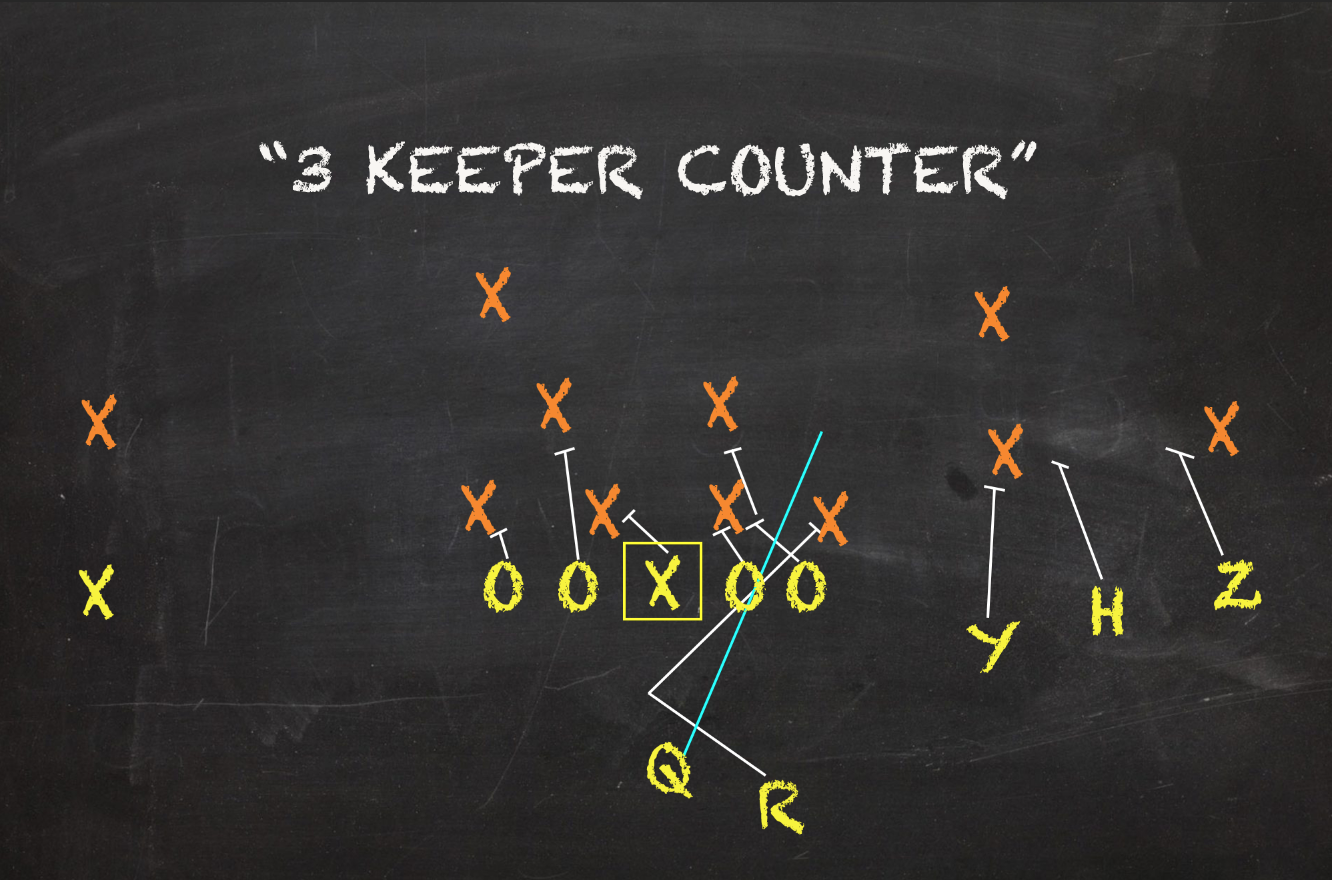
An unconventional example on how this offense uses Hurts is with their "Keeper Counter" design. Thankfully when writing about UK's Lynnsanity Offense earlier this year, I became familiar with this look. I mentioned earlier Counters can take on many forms, but they usually call for at least one puller. Keeper Counters are unique in this regard. These are meant to mimic a normal mesh point on Inside Zone Reads from the QB and RB. While the line blocks the play like its any normal inside zone, the counter action is created by the RB once he fakes a handoff after meshing with the QB. Instead of continuing onto the "zone hole", he bends back and seals the key defender. The QB then cuts right into the newly forged hole. Oklahoma has called Keeper Counters off both Slam and Bluff actions against their top level competition. Half of these looks have been successful.
Dialing up a shot via All Verts and Portland plays are also to be expected. While a good number of these plays breakdown and don't go as designed, Oklahoma's athletes are dangerous when playing backyard ball. But even though they are deep oriented pass plays, neither averaged over 7 yards/attempt.
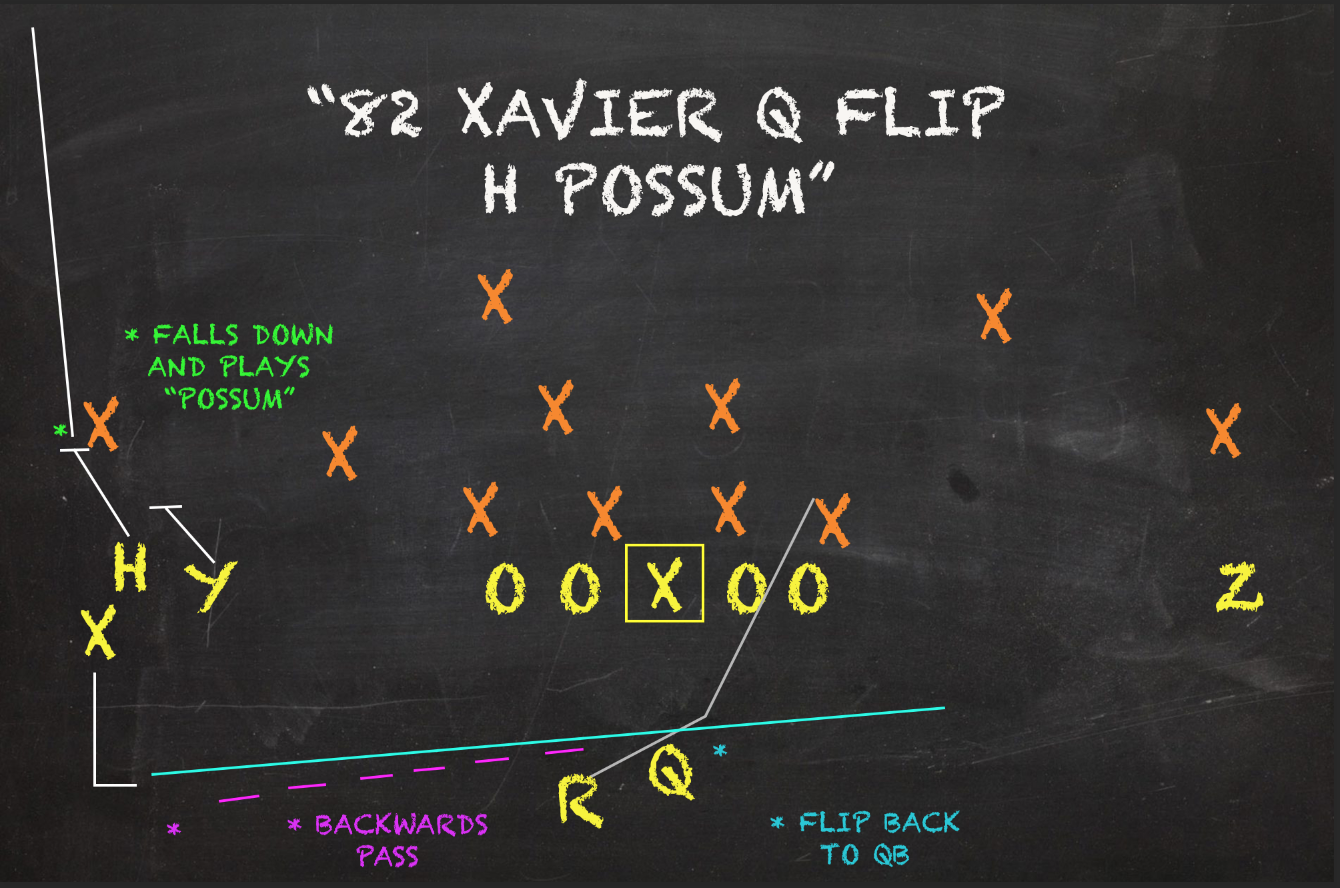
But this analysis of Oklahoma's offense wouldn't be complete without mentioning their trick plays. Since supplanting Bob Stoops as head man in Norman, there have been bountiful examples of trickeration utilized by Lincoln Riley. Over the four games of theirs I charted, I saw a fair share. Outside of running a Fake Screen "Fox" play and a few Flow/Leak/Throwback designs, the Sooners dialed up two Reverse passes and a Halfback Pass. While the Halfback Pass backfired in a bad way, both Reverse passes were successful. One of the Reverse passes went for 70 yards and the other was an easy touchdown toss.
On the big gainer, it initially looked to be a tunnel screen to the X receiver. Hurts threw a backwards pass before the wideout worked back towards him and flipped him the ball. All the while, the playside receivers pretended to block for the tunnel screen. But one of them literally fell down while selling the block. The secondary soon lost track of him since they were preoccupied watching the ball in the backfield. Moments later, that receiver was all alone down the sideline after dusting himself off. I have no clue what Oklahoma calls it, but I dubbed it "Possum" for obvious reasons. Coming in as an underdog who most people have already written off, expect Oklahoma's offense to come in with a few tricks up its sleeves.
| Oklahoma's 8 Most Called Concepts | Play Share | Yards/Attempt | Success Rate |
| Tackle Counter Reads | 11.5% | 8.72 | 48.3% |
| Inside Zone Slam Reads | 8.7% | 2.95 | 45.5% |
| Inside Zone Bluff Reads | 7.5% | 5.58 | 57.9% |
| Hoss/Comebacks | 5.9% | 10.3 | 46.7% |
| Inverted Power Veer | 5.1% | 4.85 | 38.5% |
| Mesh | 3.6% | 8.33 | 55.6% |
| QB Counter | 3.6% | 4.11 | 44.4% |
| All Verts | 3.6% | 6.56 | 44.4% |
| Oklahoma's Top 6 Yard-Gaining Concepts | Total Yards | Yards/Attempt | Success Rate |
| Tackle Counter Reads | 253 | 8.72 | 48.3% |
| Dagger | 159 | 31.8 | 100% |
| Hoss/Comebacks | 155 | 10.3 | 46.7% |
| Bluff Read | 106 | 5.58 | 57.95 |
| Jailbreak Screen | 81 | 20.3 | 50.0% |
| Mesh | 75 | 8.33 | 55.6% |
1st Down Offense
First downs often help you get a pretty good idea of what an offense is and how it likes to operate. Since first downs get more chances than any other down, they naturally reflect how offenses like to operate under an open playbook. With no pressure to gain a certain amount of yards, you get to see how a team prefers to operate for the most part. Odds are if a team is at managing down and distance on firsts, the degree of difficulties on their subsequent downs will be higher which generally leads to a lower rate of success.
Even Though Oklahoma has the most balanced Run/Pass Ratio of the four playoff teams, they definitely have preferred to start a set of downs on the ground from what I have seen. Ohio State has a higher 1st Down Rate Rate but not by much. Roughly 64% of the Sooners' plays on firsts have been runs.
Four of Oklahoma's most called 1st Down plays are all runs. All of them are among their most called looks overall. And that should make sense. With these downs seeing the most reps, it's only natural heavily featured plays to start a set of downs will end up with healthy play shares.
Tackle Counter Reads lead the way with 18 reps. Next, Inside Zone Bluff Reads (14), Slam Reads (11), and Inverted Power Veers (7) fall in line. Each of these core run concepts sport Success Rates of at least 50%. Now, Captain Obvious tell me that if you run something a lot and you are good at executing it, you should have a fairly good on-field product. Oklahoma owns the second-best 1st Down Rushing Success Rate of the four playoff offenses with a 47.4% clip. If they are ahead of the chains, they are a hard machine to stop due to their variety and efficiency.
Three separate QB Counters have been called at least three times on firsts Tackle Counters, Keeper Counters and Traditional Counters. While the latter have 50% and 67% Success Rates, respectfully, zero designed Tackle Counter looks with Hurts as the runner has been successful. Overall, these QB Counters have combined for a pedestrian 36% Success Rate.
But QB Draws have offered some solace in the designed run game. Usually a look reserved for situations when behind the down and distance, the Sooners like them on 1st Downs to set up subsequent chances. By no means has this design set the world on fire, but QB Draws have been successful on three of their five 1st Down reps. For what it is worth, all of these QB designed runs have outlet screens attached with the exception of Keeper Counters.
Hoss/Comeback pass patterns are tied with Power Veers with the fourth most 1st Down attempts. Meant to open up a set of downs with an easy outside completion or slicing a zone down the seam, these designs have been average in terms of consistency but average just under 13 yards/target in the four games of theirs I charted.
After those, a number of vertical-oriented pass patterns litter their 1st Down script. With that in mind, it should be no surprise that the most explosive offense in the playoff is its most potent on firsts. Over a quarter of Oklahoma's 1st Down pass attempts against their hardest defenses faces have gained 20 yards or more. Let me say that again. One out of four of their passes to start a set of downs results in a gain of at least a fifth of the length of the field. I don't care who you are playing; that's some good sh*t.
While you might see a Jailbreak Screen or two in these spots, deep passes like All Verts, Daggers, Crosses, and Portland Shots round out their most called looks on firsts. When its all said and done, Oklahoma's 1st Down Passing Success Rate versus the meat of their schedule was 52.3%. If it wasn't for Joe Burrow's insane 65.4% clip, this would be tops amongst the playoff passers.
| Oklahoma's Top 6 Most Called First Down Plays | No. of Reps | Yards/Attempt | Success Rate |
| Tackle Counter Read | 18 | 8.28 | 50.0% |
| Inside Zone Bluff Read | 14 | 5.43 | 50.0% |
| Inside Zone Slam Read | 11 | 4.09 | 54.6% |
| Inverted Power Veer | 7 | 5.71 | 57.1% |
| Hoss/Comebacks | 7 | 12.9 | 42.9% |
| QB Draw | 5 | 4.00 | 60.0% |
3rd Down Offense
While examining offenses on 1st Downs help diagnose tendencies and go-to looks, that is not the case on 3rd Downs. Sure over the course of the season, conclusions and nuggets of information can be found. But with reduced sample sizes, it can quickly turn into a crapshoot. That being said, I have been able to discover some items about the Sooners' 3rd Down offense.
Like I have stated, Oklahoma has the most balanced Run/Pass ratio among the playoff teams. Remember, they have a high Run Rate to start of sets of downs. So in order for their play sheet to balance out, one of the later downs has to be predominately passes. Oklahoma's offense has 48 3rd Down snaps over the four games I have charted. Of those, 37 have been pass plays. Though Clemson's 3rd Down Pass Rate is greater, Oklahoma's is only slightly less. Four of their top 5 favorite 3rd Down looks are passes.
Meshes have been targeted the most. Like I mentioned above, Lincoln Riley likes to pair these underneath intersecting shallow cross combos with intermediate Double Dig routes or Dagger concepts. Meshes have received seven targets on the money down with Double Digs getting three and a Dagger getting another. These pairings with multiple horizontal routes create a number of high-low reads across the field. However despite their potential, meshes have middling results on the money down. Their Success Rate is a mediocre 42.9% and they've averaged 6 yards/target versus the meat of their schedule in these spots. But when Hurts has felt comfortable enough to let it rip, the two patterns attacking the backend have been better. Two of three Double Digs have moved the chains as has the lone Dagger.
The Sooners' other favorite pass concept, Hoss/Comebacks, come next in the pecking order for 3rd Down targets. These share the same amount of reps as Fade Variations with four. While this offense doesn't go out of their way to feature Fades, they might show up in Goal-to-go situations. While usually a low-efficiency look, half of their targeted Fades have been successful against their top rated competitors.
Again, it can get dodgy real quick judging plays with so little reps in a vacuum. Still, Inside Zone Slam Reads and the Drive concept join Double Digs with three reps on the do or die down. While Slams and Double Digs have been good in the games I have charted, Drives went o-fer on their targets.
The Sooners have targeted six other concepts multiple times on thirds. With such a wishy washy sample size, there's a decent chance a few could be leaned on in the playoffs. These looks include All Curls, QB Draws, All Verts, QB Counters, Keeper Counters, and Smashes.
All in all, Oklahoma posted the worst 3rd Down Success Rate of the four playoff teams against their toughest competition. Both their Rushing and Passing clips have been as successful as the other with 45.6% and 45.9%, respectfully. While scrambles help inflate the numbers, their adjusted rate is the only one of the title contenders below 51% in these spots. While perhaps diminished by the level of their contemporaries, their 3rd Down Success Rate would rate as the third best in the SEC if averaged over the course of the year only trailing LSU and Alabama.
| Oklahoma's Top 6 Most Called Third Down Plays | No. of Reps | Yards/Attempt | Success Rate |
| Mesh | 7 | 6.00 | 42.9% |
| Hoss/Comebacks | 4 | 4.25 | 25.0% |
| Fade Variations | 4 | 4.00 | 50.0% |
| Inside Zone Slam Read | 3 | 6.00 | 66.7% |
| Double Digs | 3 | 15.0 | 66.7% |
| Drive | 3 | 0 | 0.0% |