2020 SEC Statcast: Halfway Point Special
Clark dove deep into the stats for this nearly two-hour special. The "Four Downs" for each SEC team with a win range from year-over-year changes between schemes to improvement/regression between players to statistical standouts to X's and O's.
Tired of the dribble? Skip to the team(s) you care about! Stat Nerds, be sure to follow along with SEC Statcat's Special Notes! (posted below)
Alabama
1st Down: Keeping up with the Joneses - 01:25
2nd Down: Out with a Waddle, not with a bang - 4:10
3rd Down: Elephant in the Room - 6:19
4th Down: Sabanmetrics - 10:11
Arkansas
1st Down: Wooo That Defense! - 12:11
2nd Down: Let me be Franks - 14:00
3rd Down: Arkansas' Hogmollies need to be lead to slaughter - 16:02
4th Down: Examining 3rd Down - 17:59
Auburn
1st Down: Broke Nix? - 20:00
2nd Down: If it Looks like a Tank and Runs like a Tank... 22.26
3rd Down: Less is Morris? - 23:42
4th Down: Crack in the Steele? - 24:40
LSU
1st Down: TMJ=CC 2.0 - 27:45
2nd Down: Best Back in the Bayou - 29:29
3rd Down: Bo PelinD - 31:36
4th Down: The Tigers' New (Offensive) Stripes - 34:03
Mississippi State
1st Down: Time to Hoist the Jolly Rogers? - 37:29
2nd Down: Over the Hill - 39:18
3rd Down: Bully of a Defense - 42:42
4th Down: The Air Raid's favorite looks - 44:01
Ole Miss
1st Down: Okay Corral - 45:32
2nd Down: We want some Moore - 47:47
3rd Down: The Lane Train Offense - 49:20
4th Down: DisMISSible Defense - 53:23
Texas A&M
1st Down: Mond over Matter - 54:05
2nd Down: Spill the Thrill - 56:08
3rd Down: Vets, Thank you for you Service - 57:26
4th Down: The Defense is... fine - 59:00
Florida
1st Down: Back on Trask - 1:01:39
2nd Down: Gators on the Ground - 1:04:41
3rd Down: 3rd and ... what's the phrase again? - 1:07:41
4th Down: Life is the Pitts - 1:08:33
Georgia
1st Down: The Big D - 1:09:56
2nd Down: Monken it Work on Offense - 1:11:12
3rd Down: Milton of a Man - 1:14:51
4th Down: Where the dickens is George Pickens? - 1:16:02
Kentucky
1st Down: The Big Blue Wall - 1:17:59
2nd Down: This won't pass as a passing game - 1:20:30
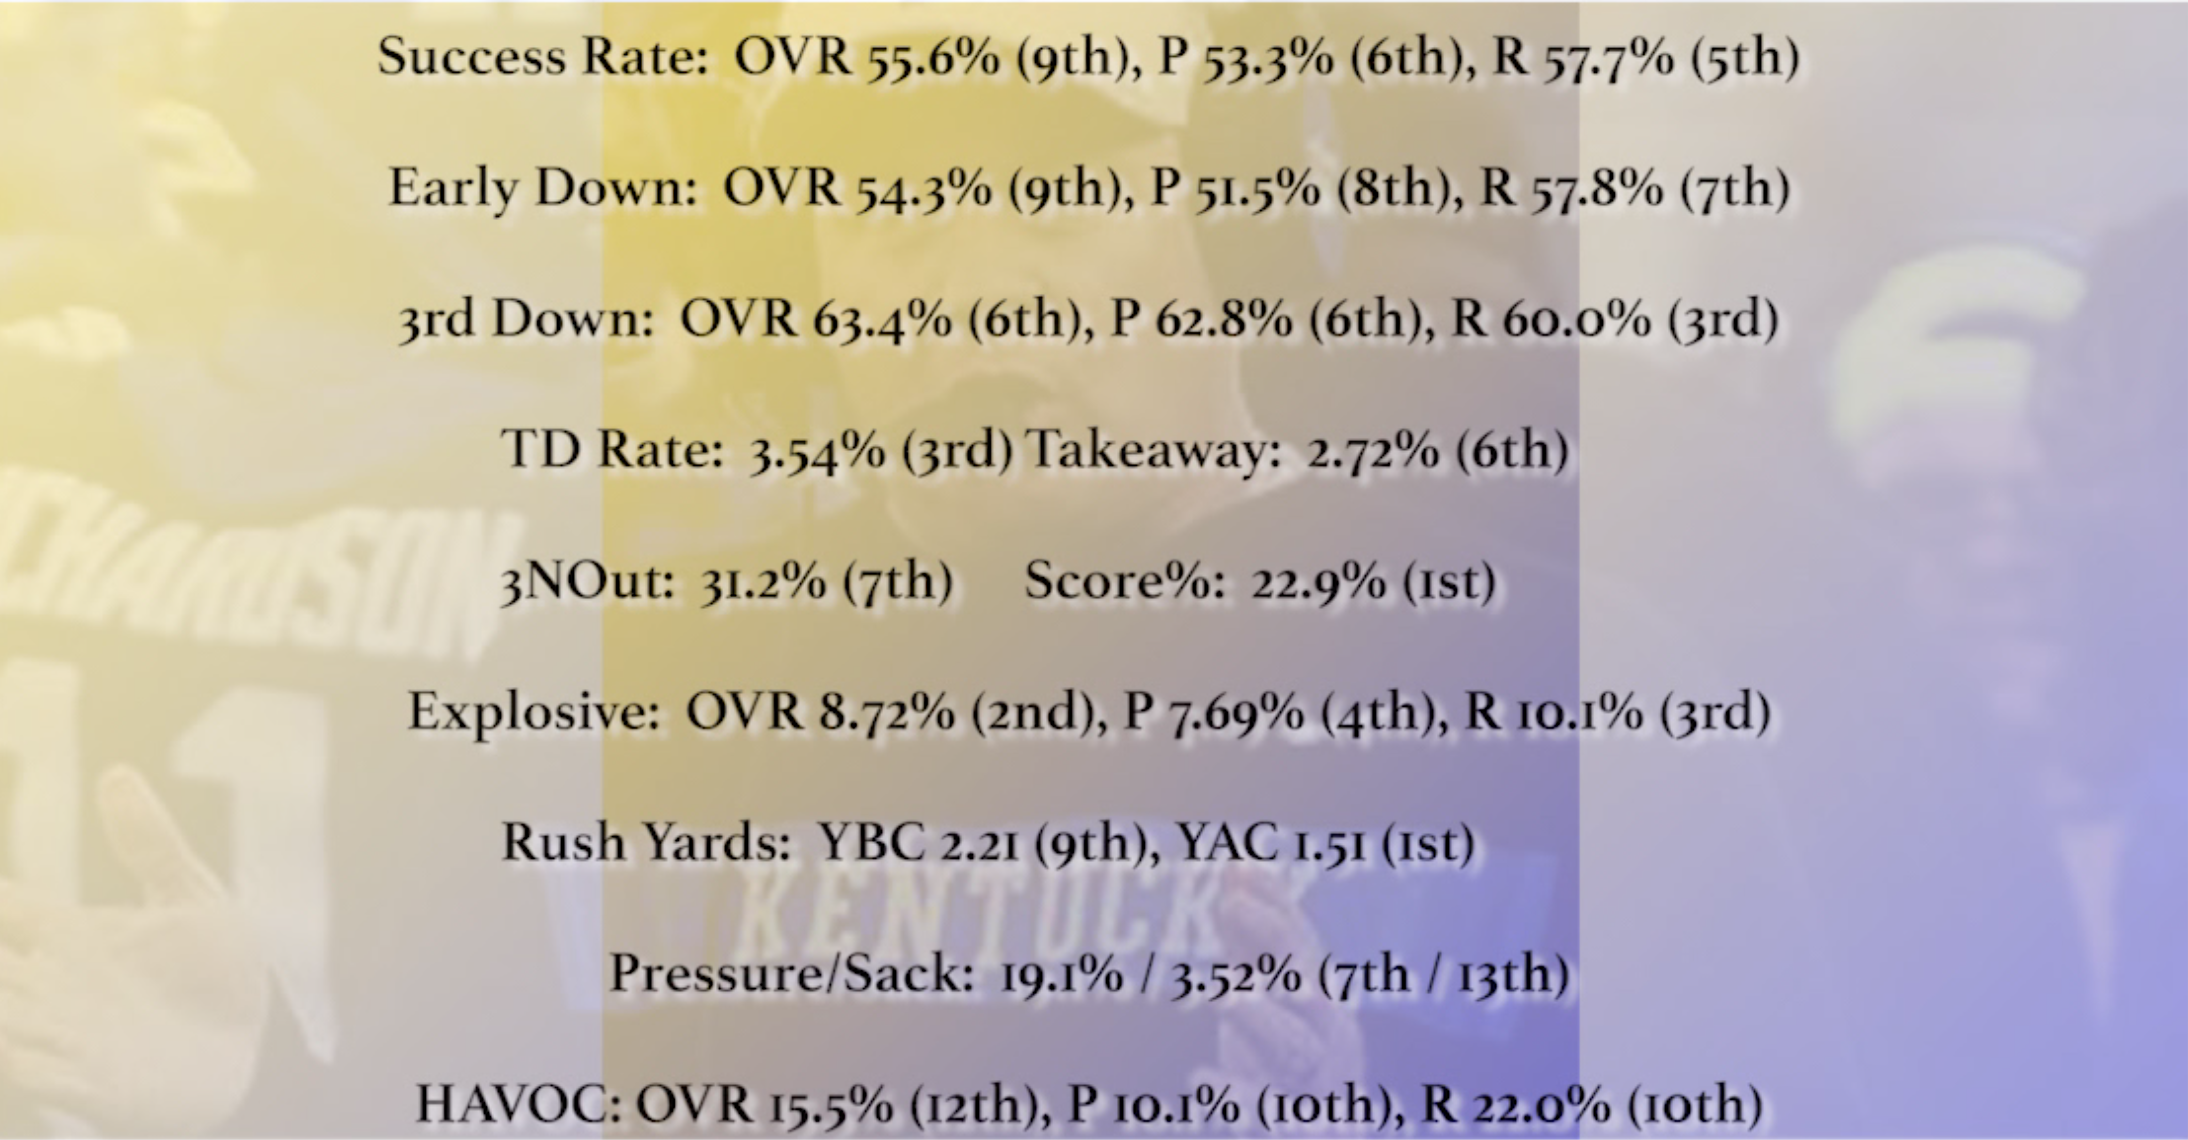
3rd Down: In Defense of their Defense - 1:22:17
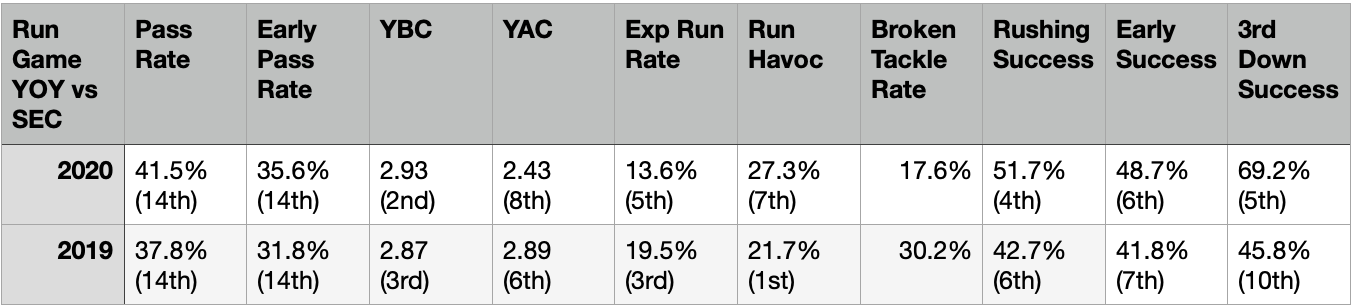
4th Down: The Cats' Core Run Looks - 1:24:08
Missouri
1st Down: The Straw that Stirs the Drinkwitz - 1:27:10
2nd Down: Bazelak Attack - 1:30:40
3rd Down Golden on the Money Down - 1:32:23
4th Down: Meh-zou after contact - 1:34:00
South Carolina
1st Down: King of the Hill - 1:35:33
2nd Down: Something Fenwicked this way comes? - 1:37:18
3rd Down: The Boboffense - 1:39:08
4th Down: SCARred Defense - 1:43:15
Tennessee
1st Down: Guarantan-- I don't know - 1:44:44
2nd Down: Bland Ole Rocky Top - 1:47:02
3rd Down: Gray Area - 1:48:36
4th Down: Orange you glad I brought up the Defense? - 1:49:55
Vanderbilt
Off the Cuff - 1:51:16-1:54:45
For even more detail, check below for SEC Statcat's notes on each down! Quite frankly, there wasn't enough time to mention ALL of them in the Special!
Alabama:
1: Keeping up with the Jones (Mac Jones stats)
- 1st in OVERALL Accuracy% (73.9%), Adj Comp (87.8%), DAA% (62.4%), 1DTD% (58.2%), Explosive Pass Rate (17.8%), Y/A (13.1)
- 1st in Deep Yards (748), Comp% (66.7%)
- 1st in Dropback Success Rate (67.9%), EXP (24.3%), Adj Comp% (82.5%), 1DTD% (65.1%), Y/A (15.2),
- 1st in Behind the Chains Success Rate (62.5%), EXP (22.9%), 1DTD% (54.2%), ADOT (12.4), Accuracy% (75%), Y/A 16.9%
- 1st in Pressured Success Rate/1DTD% (55.6%), EXP (22.2%)
And many, many other instances of being second or third…
Burrow OVR: SR 1st (60.7%), EXP 3rd (15.4%), Accuracy 1st (75.1%), Adj Comp (84.3%), DAA% (64.8%), 10.8 Y/A
2: Out with a Waddle instead of a bang (Ode to Waddle, career)
So many stats to mention; let's focus on the highlights.
2020: 1st in Y/T (19.2), Deep Catch Rate (85.7%)
2nd in yards (557), Deep yards (329), Creation% (10.3%), 1DTD% (65.5%), Catch Rate (86.2%)
3rd in YAC (11.2)
Top10 in Explosive Catch Rate (24.2%),
2019: 1st in Catch Rate (82.5%), EXC (27.5%), Inaccurate Catch Rate (54.7%), Depth Adj Catch Rate (86.7%), Deep Catch Rate (83.3%), YAC (12.0), Behind the Chains Success Rate (78.6%), EXC, 1DTD, Y/T
2nd in Success Rate (67.5%)
3rd in Yards/Target (14.0),
2018: 1st in 3rd Down SR (66.7%), 3rd Down Y/T (14.0), 3rd Down EXC (40%), Deep Catch Rate (90%), Overall SR (67.9%), Depth Adj Catch Rate (79.5%), Y/T (15.2)
3: Elephant in the Room - (how Sark’s offense is nearly impossible to pin down)
- Alabama uses most motions in SEC. Dizzying array of eye candy that threatens the edge and horizontally stretches the defense. 1st Motion% (37.1% next closest 20.8%), 5th Jet (9.65%), 1st Orbit (7.31%) — consistent mix on runs/passes
- If teams sink they will attack the flat with their speed in space. If teams press, they aim to take off deep. Jones has top PA Rate (35.6%). Always on the attack. 2 Deep gets run or misdirection, 1 Deep pass
- TARGETED 8 Yankee Shots, 5 Deep Double Moves, 4 All Verts, 3 Leaks, 3 Double Posts,
- Favorite passes: Cross (90% SR), Kelly Mesh (90% SR), Comebacks/Deep Hooks (76.9%), Sail 66.7%), Portland (37.5%)
- Anchored by power run (Counter, Duo), OZ —> 53% of run game
4: Saban’s defense year over year (in SEC Play)
Success Rate:
OVR 59.5% (3rd), P 58% (5th), R 62.1% (3rd) OVR 59.2% (8th), P 59.9% (6th), R 57.4% (7th)
Early Down:
OVR 61.9% (2nd), P 60.3% (3rd), R 64.2% (3rd) OVR 58.7% (8th), P 58.1% (5th), R 59.1% (8th)
3rd Down:
OVR 53.1% (9th), P 51.1% (10th), R 57.7% (4th) OVR 60.5% (11th), P 65.1% (8th), R 47.2% (13th)
TD Rate:
4.05% (5th) 3.79% (4th)
Takeaway:
2.7% (7th) 2.89% (5th)
3NOut:
29.3% (9th) 32.3% (9th)
Score%:
39.6% (7th) 35.5% (9th)
Explosive:
OVR 10.0% (5th), P 8.29% (5th), R 10.2% (5th) OVR 10.8% (4th), P 6.69% (1st), 14.1% (7th)
Rush Yards:
YBC 1.71 (3rd), YAC 2.22 (5th) YBC 2.57 (11th), 2.30 (4th)
Pressure/Sack:
19.6% / 3.43% (6th / 14th) 28.2% / 5.9% (1st / 5th)
Arkansas:
- Wooo that defense (Odom’s defense)
- 1st in TD Rate Allowed (2.99%%), Yards/Pass (4.89)
- Top3 in Takeaway Rate (3.58%), 1D Rate Allowed (24.8%), Success Rate (60.9%), 15+ Rate (7.16%)
- Top5 in Score Rate Allowed (30.8%), Y/P (4.96), Explosive Play Rate (9.85%), HAVOC Rate (18.8%)
*BIG change from being bottom5/3 Across the board last year in SEC play
2. Let me be Franks (Feliepe Franks with Kendall Briles)
PAST: accurate, PA reliant, conservative despite good arm talent, poor decision-making with TWT
2020: accurate, PA reliant, overly conservative despite arm talent, keeping the ball safe
Briles letting FF play to his strengths:
- Top4 Accuracy% (66.4%), Adj Comp (79.6%), Defender Breakup (7.03%), DAA% (59.3%), Interceptable Pass Rate (5.47%), Uncatchable Pass Rate (13.3%), AVR number of Blockers (6.58), Deep Adj Comp% (45.5%)
- Top2 PA Rate (29.7%), RPO Throw Rate (28.9%), Deep Accuracy (53.9%), Bottom2 ADOT (7.11)
3. Arkansas’ Hogmollies need to be taken out to slaughter (YBC, run game woes, pressure, OL talk)
- Bottom4 YBC (1.72), LAST in YAC (1.88), LAST in Y/C (3.55), Bottom2 in Run HAVOC (42.1%), LAST in Rushing Success Rate (34.9% worst by ~5%), Bottom4 in Negative Play Rate (10.3%), 3rd highest Sack Rate (4.26%), Highest Pressure Rate (33.9%)
- Franks 2nd-highest raw Pressure Rate (25.8%), 3rd highest Sack Rate (8.59%), TIED- highest Dropback Pressure Rate (30%), 3rd highest Dropback Sack Rate (11.4%)
4. 3rd Down Examination (2nd best D, 2nd worst O 3D SR)
3rd Down | OVR SR | AVR Distance | Pass SR | Run SR | Short ( <3) | Long (>6) |
OFF | 32.8% (13th) | 6.89 (11th) | 34.1% (10th) | 29.4% (14th) | 40.0% (13th) | 28.1% (8th) |
DEF | 67.7% (2nd) | 6.26 (11th) | 63.2% (5th) | 61.1% (1st) | 47.4% (2nd) | 71.4% (9th) |
OFF - longest distance to gain on 3D runs, 2nd highest RPO play Rate on runs, 4 HAVOC plays on 11 carries
- 60% Run Rate on 3rd and Short, 4 Negative Plays (2 sacks)
- 84.5% Pass Rate on 3rd and Long, 4 Neg Plays (2 Sacks), 4 Scrams, 4 15+ gains, 4th highest HAVOC
DEF - 3rd lowest average distance to gain on 3D passes, LAST in Pressure but 3rd in OVR/Pass HAVOC
- 5th lowest average distance to gain on 3D runs, only 2 total HAVOC plays
Auburn:
- Broke Nix? (Nix splits year over year, issues)
Nix YOY | Succ Rate | Acc% | Adj Comp | DAA% | 1DTD% | INTA% | Y/A | Screen+ RPO | Deep Acc% | 3D SR | PRE SR |
2020 | 40.7% (12th) | 58.1% (12th) | 70.1% (11th) | 40.7% (13th) | 29.7% (12th) | 7.56% (9th) | 6.44 (12th) | 38.4% (1st) | 33.3% (t-8th) | 39.6% (10th) | 25.0% (12th) |
2019 | 42.2% (12/19) | 54.6% (12/19) | 66.2% (13/19) | 41.2% (13/19) | 31.6% (11/19) | 5.84% (6/19) | 6.74 (12/19) | 34.5% (1st) | 33.3% (t-4/14) | 37.6% (7/19) | 26.6% (14/19) |
2. The Tank is locked and loaded (min 17 att)
1st in First Down Runs (23)
Top3 in Rush Yards (432), Y/C (5.84), Broken Tackles (31), BT Rate (41.9%),
Top5 in YAC (3.58), Explosive Runs (13)
Top10 in First Down+TD Rate (35.1%), Explosive Run Rate (17.6%)
3. Less is Morris? (Auburn offense year over year vs SEC)
OFF YOY | OVR SR | Pass SR | Run SR | Early SR | 3D SR | Pass Rt | Early Pass Rt | RPO Rt | OVR EXP | Pass EXP | Run EXP | TD Rate | TO Rate | 3NOut% |
2020 | 44.6% (7th) | 39.1% (11th) | 52.0% (3rd) | 44.6% (6th) | 45.9% (7th) | 57.1% (3rd) | 50.6% (6th) | 37.1% (1st) | 14.2% (3rd) | 7.61% (9th) | 22.9% (1st) | 3.72% (10th) | 1.15% (1st) | 18.5% (7th) |
2019 | 40.5% (7th) | 40.0% (t-5th) | 40.9% (8th) | 41.2% (8th) | 38.8% (4th) | 49.0% (11th) | 43.3% (10th) | 31.6% (2nd) | 9.80% (11th) | 8.00% (7th) | 11.5% (14th) | 5.13% (4th) | 1.95% (8th) | 27.5% (9th) |
4. Crack in the Steele? (weaknesses around the defense)
*** Issues getting teams off the field
- Bottom5 3NOut Rate (27.8%), Takeaway Rate (1.63%), Score Drive Rate (26.8%), TFL Rate (8.4%), Sack Rate (5.23%), Pressure Rate (16.3%), Run Havoc Rate (20.3%), YBC (2.44)
- AVERAGE TD Rate Allowed (4.61%), Yards/Game, OVR Success Rate, OVR HAVOC
- on 3rd Down: 3rd Worst SR, 5th Worst Run Miss Tackle Rate, 2nd lowest TFL Rate, 3rd highest YBC (3.03), 5th highest YAC (2.23), 3rd highest Yards to Gain AVR (6.06)
LSU:
- Terrace Marshall Jr = Cris Carter
- CC 130 TDs across 1515 targets (1101 catches) TD Rate of 11.8%
Carter gets rep for only catching touchdowns thanks this his 3rd season (11 TDs, 45 catches 24.4% TD Rate) While the degree of difficulty is higher in the NFL, TMJ is putting up stats that scream most of his catches matter.
- Owned SEC’s Catching Success Rate (66.7%) in 2019 and 1DTD% (57.7%) while catching 11/13 RZ tgts with 10 TDs
- Higher SR YOY 70.3% (2nd) with slightly lower 1DTD% 54.1% (6th). TD Rate is 3x Carter’s (33.3%)
2. Which running back looks the best
Rush SR | YBC | YAC | EXR% | 1D+TD% | Neg% | BT % | Share | |
Curry | 41.2% (28th) | 1.74 (28th) | 1.94 (29th) | 5.88% (31st) | 17.7% (21st) | 11.8% (31st) | 5.88% (35th) | 13.5% |
Davis-Price | 58.0% (5th) | 2.12 (20th) | 2.88 (9th) | 10% (t-24th) | 32% (14th) | 4.0% (6th) | 20% (t-24th) | 39.7% |
Emery | 58.9% (3rd) | 2.85 (9th) | 2.92 (8th) | 23.1% (4th) | 38.5% (3rd) | 5.13% (10th) | 38.5% (5th) | 30.9% |
3. Beau PenilinD (good/bad about the defense)
Success Rate:
OVR 54.8% (10th), P 52.1% (8th), R 50.0% (12th)
Early Down:
OVR 54.2% (10th), P 50.5% (10th), R 52.2% (11th)
3rd Down:
OVR 56.6% (8th), P 54.1% (7th), R 33.3% (10th)
TD Rate:
5.70% (11th)
Takeaway:
3.42% (4th)
3NOut:
34.0% (6th)
Score%:
42.6% (9th)
Explosive:
OVR 15.2% (12th), P 18.3% (14th worst by 4+), R 13.7% (11th)
Rush Yards:
YBC 2.90 (13th), YAC 2.81 (11th)
Pressure/Sack:
22.9% / 8.70% (2nd / 2nd)
HAVOC:
OVR 21.7% (1st), P 17.4% (1st), R 28.4% (2nd)
4. The Tigers’ new stripes (offensive changes)
- IZ Slam Reads lead - same Play Share (17.5%), production has soured (-1.9 Y/C, -6.5% SR)
- Inserts usage up, but appears to be matchup-based (17 reps, 76.5% SR, 7.41 Y/A) 6th most yards
- Running All Verts more, most targeted Concept (7.82% Play Share, 43.5% SR - 2.6%, 48% in 2019)
- Dagger is coming back with a vengeance 6 reps 83.3% SR, 28.3 Y/A
- Less Corners, Comebacks, Levels
** despite most-run play being bad, Rushing SR up ~+5%, pass down ~-12%
** Though great preventing pressure, Brennan is AWFUL on 3rd Down (19.2% SR, 41.7% AVR)
Miss State:
- Time to hoist the Jolly Rogers ? (a case for Will Rogers to start)
Passing Downs | Success Rate | Depth Adj Acc% | 1D+TD % | INTA% | EXP% | ADOT | Y/A |
Costello | 34.3% | 50.2% | 29.9% | 11.9% | 16.4% | 8.75 | 8.09 |
Rogers | 50% | 58.4% | 50% | 8.33% | 8.33% | 7.33 | 8.75 |
SEC AVR | 39.4% | 51.7% | 34.9% | 8.46% | 10.3% | 8.49 | 7.90 |
2. Over the Hill (looking at the remaining RBs with Hill gone)
Y/R | Run Success | EXR% | BT% | Run 1D+TD% | Y/T | Catch Success | EXC% | Drop% | Catch 1D+TD% | |
Marks | 4.05 | 45.5% | 4.55% | 13.6% | 31.8% | 3.74 | 29.6% | LOL | 11.1% | 26.1% |
Johnson | 3.83 | 33.3% | LOL | 33.3% | 25% | 3.31 | 30.8% | LOL | 0.0% | 18.2% |
** Hill of course looked potent in the opener and held 2nd-best Catching Success Rate on team )48.3%)
3. Bully of a defense (not a crazy offensive slate, but holding its own)
Success Rate:
OVR 58.5% (4th), P 58.5% (4th), R 53.3% (9th)
Early Down:
OVR 56.9% (6th), P 53.9% (6th), R 55.5% (9th)
3rd Down:
OVR 64.8% (5th), P 74.1% (1st), R 42.1% (5th)
TD Rate:
4.26% (6th)
Takeaway:
2.33% (8th)
3NOut:
41.2% (3rd)
Score%:
29.4% (3rd)
Explosive:
OVR 9.69% (3rd), P 6.78% (2nd), R 13.1% (10th)
Rush Yards:
YBC 2.00 (7th), YAC 1.98 (3rd)
Pressure/Sack:
18.4% / 8.82% (8th / 1st)
HAVOC:
OVR 18.2% (7th), P 13.2% (7th), R 23.8% (7th)
4. The favorite looks of the Air Raid so far
a) Mesh, Mesh, Mesh!!! 40 reps (13.2% Share), 269 yards (17.5% Share), 6.73 Y/A, 40% Success Rate
b) Trail Variations: 24 reps, 128 yards, 5.33 Y/A Trails have 50% SR (mostly RB variety), Follow+R Wheel
c) All Verts: 17 reps, 134 yards, 7.88 Y/A 35.3% Success Rate
d) Screens: 19 reps 96 yards, 5.05 Y/A 42.1% Success Rate
e) Stick: 15 reps, 63 yards, 4.20 Y/A 46.7% Success Rate
f) Shallow 15 reps, 106 yards, 7.07% 40.0% Success Rate
g) Chinas 12 reps, 48 yards 4.00 33.33% Success Rate
- and they checked downed 12x and turned to Its 34 times…
Ole Miss:
- OK Corral? (is he bad or is he good?)
OVR SR | 1DTD% | INTA% | EXP% | ADOT | scrn+RPO% | Depth Adj Acc% | 10+ SR | 10+ Acc% | 10+ INTA% | PRE DAA% | PRE INTA% | PRE SR | 3D SR | 3D DAA% | 3D PRE% | |
Corral | 52.9% (3rd) | 43.8% (3rd) | 7.84% (6th) | 13.1% (4th) | 10.8 (2nd) | 26.8% | 48.5% (9th) | 50% (6th) | 46.9% (7th) | 15.6% (11th) | 59.8% (2nd) | 3.70% (3rd) | 44.4% (t-3rd) | 48.3% (5th) | 63.5% (4th) | 27.6% (10th) |
last 2 | 38.5% | 30.8% | 15.4% | 6.15% | 10.0 | 32.7% | 39.3% | 26.9% | 38.5% | 34.6% | 58.3% | 11.1% | 44.4% | 38.5% | 57.4% | 7.69% |
SEC AVR | 46.9% | 37.3% | 7.22% | 10.5% | 8.58% | 21.3% | 50.3% | 47.6% | 46.6% | 12.2% | 42.8% | 8.85% | 33.3% | 42.1% | 50.5% | 30.2% |
Still great under pressure but when predetermining RPO throws or misreading zones in clean situations has undercut his tremendous start. The poor 10+ passing of late is DAMNING
2. We Want some Moore (Elijah moore stats)
- 1st in yards (595), catches (47), Target Share (38.2%), 3rd Down Target Share (48.3%)
- Top3 in targets (58), 1D+TD catches (29), 3D catches and targets
- Top 10 in Catch Rate (81%), Y/T (10.3)
* 39.5% of Ole Miss receiving yards, 44% of catches, 36.3% YAC production, 45.6% of Rec. 1Ds, 33.3% of explosive catches, other WR starters each have sub-50% SR
3. The Lane Train (offense year over year vs SEC)
OFF YOY | OVR SR | Pass SR | Run SR | Early SR | 3D SR | Pass Rt | Early Pass Rt | RPO Rt | OVR EXP | Pass EXP | Run EXP | TD Rate | TO Rate | 3NOut% |
2020 | 47.9% (5th) | 50.5% (3rd) | 45.4% (9th) | 46.6% (4th) | 50.7% (4th) | 48.6% (12th) | 46.6% (9th) | 35.1% (2nd) | 14.8% (2nd) | 10.8% (5th) | 18.5% (3rd) | 5.99% (4th) | 2.24% (8th) | 13.9% (4th) |
2019 | 40.0% (8th) | 37.7% (9th) | 41.7% (7th) | 41.1% (7th) | 34.4% (11th) | 41.9% (13th) | 33.2% (13th) | 31.9% (1st) | 13.7% (5th) | 9.31% (6th) | 16.9% (6th) | 4.75% (5th) | 1.86% (7th) | 21.9% (3rd) |
SCHEMES
- IZ Reads (even mix of Bluff/Slam but Bluffs better): 22% Play Share, 15% Yard Share, 51.7% SR, 4.46 Y/A
2. Counters (both read and straight) 7% Play Share, 5.5% Yard Share, 46% SR 5.9 Y/A
3. Slant Variations, usually attached to IZ Reads: 6% Play Share, 6.6% Yard Share, 66.7% SR, 7.21 Y/A
4. All Verts, not overly efficient but a later down look: 5% Play Share, 5% Yard Share, 30% SR, 6.55 Y/A
5. OZ Read, Lane wants to work the edges, bad returns: 5% Play Share, 2.7% Yard Share, 25% SR, 3.55 Y/A
complimentary concepts include Empty Jet Veers, Y-Insert, Tackle Trap, Split Zone with Jet, Waggles, Cross, Mesh, Pivot/Salem, Utah
- Lowest presnap Motion Rate (6.27%)
- Highest Jet Motion Rate (21.1%)
- 6th-most Orbit Motion Rate (1.75%
- Average empty usage ~3.5% of plays —> BEST SR 85.7%, 42.9% 15+ play Rate
4. disMISSible defense (ole miss defense sucks)
Success Rate:
OVR 42.6% (14th), P 38.9% (14th worst by 8%), R 41.0% (14th)
Early Down:
OVR 42.5% (14th), P 37.5% (14th), R 43.5% (14th)
3rd Down:
OVR 43.3% (13th), P 45.2% (13th), R 23.8% (14th)
TD Rate:
6.88% (14th)
Takeaway:
1.32% (14th)
3NOut:
28.6% (10th)
Score%:
57.1% (14th)
Explosive:
OVR 15.8% (13th), P 11.3% (8th), R 21.1% (13th)
Rush Yards:
YBC 2.90 (13th), YAC 3.71 (14th)
Pressure/Sack:
20.2% / 5.62% (4th / 8th)
HAVOC:
OVR 12.7% (14th), P 7.87% (14th), R 17.0% (14th)
TAMU:
- Mond over matter (where he stands)
OVR SR | 1DTD% | INTA% | EXP% | ADOT | scrn+RPO% | Depth Adj Acc% | 10+ SR | 10+ Acc% | 10+ INTA% | PRE DAA% | PRE INTA% | PRE SR | 3D SR | 3D DAA% | 3D PRE% | |
Mond | 46.9% (6th) | 34.6% (8th) | 8.46% (11th) | 6.92% (13th) | 8.85 (7th) | 13.9% | 55.3% (5th) | 32.6% (14th) | 43.5% (8th) | 17.4% (12th) | 30.2% (11th) | 13.3% (12th) | 26.7% (10th) | 56.3% (2nd) | 72.9% (1st) | 28.1% (9th) |
SEC AVR | 47.1% | 37.6% | 7.08% | 10.6% | 8.66 | 23% | 50.3% | 47.6% | 46.6% | 12.1 | 42.8% | 8.85% | 33.3% | 41.7% | 49.8% | 30.5% |
2. Spiller Stats
- 2nd in 1D+TD% (39.1%)
- 3rd in YAC average (4.03), Explosive Run Rate (25%)
- 5th in Broken Tackles (22), 1D+TD runs (25)
- 7th in Broken Tackle Rate (34.4%)
- 9th Success Rate (54.7%)
- 10th in YAC Makeup (60%)
3. Thank you for you service, vets (OL talk, year over year)
OL YOY vs. SEC | Pressure Rate (team) | Sack Rate (team) | Dropback Pressure (Mond) | Rush YBC | Rush Success | Neg Run Rate |
2020 | 23.6% (4th) | 0.78% (1st) | 24.8% (9th) | 2.54 (4th) | 50.0% (6th) | 11% (10th) |
2019 | 38% (11th) | 4.89% (14th) | 31.4% (17/19) | 2.27 (6th) | 44.9% (3rd) | 8.63% (5th) |
4. Defense is….fine
Success Rate:
OVR 57.9% (5th), P 50.0% (11th), R 63.0% (2nd)
Early Down:
OVR 60.5% (4th), P 51.1% (9th), R 67.5% (2nd)
3rd Down:
OVR 50.9% (11th), P 48.5% (11th), R 36.4% (9th)
TD Rate:
5.46% (9th)
Takeaway:
2.52% (8th)
3NOut:
38.5% (4th)
Score%:
41.0% (8th)
Explosive:
OVR 10.1% (6th), P 11.7% (9th), R 7.98% (2nd)
Rush Yards:
YBC 1.58 (1st), YAC 2.26 (6th)
Pressure/Sack:
19.9% / 6.85% (5th / 4th)
HAVOC:
OVR 18.5% (5th), P 13.7% (5th), R 26.1% (4th)
Florida:
- Back on Trask (Trask numbers)
Trask vs SEC YOY | OVR SR | 1DTD% | INTA% | EXP% | ADOT | scrn+RPO% | Depth Adj Acc% | 10+ SR | 10+ Acc% | 10+ INTA% | PRE DAA% | PRE INTA% | PRE SR | 3D SR | 3D DAA% | 3D PRE% |
2020 | 58.3% (2nd) | 49.5% (2nd) | 6.8% (8th) | 14.6% (2nd) | 7.88 (8th) | 20.4% | 59.8% (2nd) | 51.0% (3rd) | 51.4% (4th) | 11.4% (7th) | 57.9% (3rd) | 0.00% (1st) | 46.2% (2nd) | 59.1% (1st) | 70.9% (2nd) | 45.5% (14th) |
2019 | 51.0% (2nd) | 40.6% (3rd) | 7.63% (11th) | 12.9% (7th) | 9.68 (8th) | 19.2% | 52.9% (3rd) | 51% (3rd) | 52.0% (3rd) | 13.0% (10th) | 55.8% (2nd) | 7.94% (10th) | 49.2% (2nd) | 31.9% (12th) | 40.7% (9th) | 27.7% (7th) |
- less screens on average, big jump on 3rd downs, other numbers consistent ESPECIALLY INTAs
2. Gators on the Ground (run game improvement year over year, changes)
Run Game YOY vs SEC | Pass Rate | Early Pass Rate | YBC | YAC | Rushing Success | Exp Run Rate | Broken Tackle Rate | Top Run Looks |
2020 | 62.4% (2nd) | 58.2% (2nd) | 1.47 (14th) | 3.91 (1st) | 51.5% (5th) | 10.3% (12th) | 32% | Counter Read 41.7%, 4.25 |
2019 | 60.4% (3rd) | 58.8% (3rd) | 1.55 (14th) | 3.38 (1st) | 36.5% (13th) | 13.9% (11th) | 23.4% | OZ Read 54.5%, 7.40 |
* | Better in short yardage, | All Powers 33.3%, 3.5 | ||||||
* | no explosive runs | IZ 66.7% 6.50 |
3. 3rd and… what’s the phrase? (defense on 3rd, lead into general defense issues)
Success Rate:
OVR 46.8% (13th), P 50.0% (11th), R 63.0% (2nd)
Early Down:
OVR 60.5% (4th), P 51.1% (9th), R 67.5% (2nd)
3rd Down:
OVR 50.9% (11th), P 48.5% (11th), R 36.4% (9th)
TD Rate:
5.53% (10th)
Takeaway:
1.70% (11th)
3NOut:
25.8% (13th)
Score%:
48.4% (12th)
Explosive:
OVR 12.3% (10th), P 11.7% (9th), R 7.98% (2nd)
Rush Yards:
YBC 1.88 (5th), YAC 2.65 (10th)
Pressure/Sack:
22.4% / 5.97% (3rd / 6th)
HAVOC:
OVR 20.9% (2nd), P 13.4% (6th), R 30.7% (1st)
- 2nd best in TFL Rate 9.79%
- 14th in missed Tackled Rate 39.6%
4. Life is the Pitts (kyle Pitts)
*highest graded college player per PFF, very high in PFF WAR, all catches have resulted in 1D/TD
- 1st in Creation Rate (12%), Contested Catch Rate (66.7%)
- Top3 in 1D+TD Rate (64%)
- Top10: Success Rate (64%), Y/T (10.9), 1D+TD catches (16),
YARD MAP —> MED+Short Right, Deep Middle, MED+Short Left in that order of share
Target MAP —> MED Left, Short Right — MINI u shape: left to right short all areas, all med but middle
Georgia:
- The Big D (defense prowess)
Success Rate:
OVR 66.0% (1st by 5%), P 62.8% (1st), R 65.7% (1st)
Early Down:
OVR 66.0% (1st), P 60.4% (2nd), R 70.8% (1st)
3rd Down:
OVR 68.4% (1st), P 71.4% (2nd), R 30.0% (t-12th)
TD Rate:
2.99% (t-1st)
Takeaway:
4.10% (1st)
3NOut:
50.0% (1st)
Score%:
26.0% (2nd)
Explosive:
OVR 6.72% (1st), P 7.43% (3rd), R 5.88% (1st)
Rush Yards:
YBC 1.62 (2nd), YAC 1.76 (2nd)
Pressure/Sack:
25.9% / 7.83% (1st / 3rd)
HAVOC:
OVR 18.3% (6th), P 14.5% (4th), R 24.5% (5th)
2. Monkin it work on offense (year over year changes on offense)
OFF YOY | OVR SR | Pass SR | Run SR | Early SR | 3D SR | Pass Rt | Early Pass Rt | RPO Rt | OVR EXP | Pass EXP | Run EXP | TD Rate | TO Rate | 3NOut% |
2020 | 44.1% (8th) | 40.0% (8th) | 48.3% (7th) | 43.4% (9th) | 46.9% (6th) | 50.9% (8th) | 45.5% (10th) | 25.3% (6th) | 10.5% (10th) | 8.39% (8th) | 12.8% (6th) | 4.19% (7th) | 1.94% (6th) | 14.0% (6th) |
2019 | 42.2% (5th) | 40.0% (t-5th) | 44.3% (4th) | 43.2% (5th) | 38.1% (5th) | 48.7% (11th) | 40.4% (12th) | 11.8% (13th) | 11.4% (8th) | 7.24% (9th) | 15.4% (7th) | 3.35% (10th) | 1.17% (3rd) | 22.6% (4th) |
SCHEMES:
- still led by IZ Reads (Slams have 17.4%, 13.8% Play, Yard Share) 42.7% SR, 4.44 Y/C
- more pulling lineman, mix of duos —> Inside power 4.8% Play, 3.9% Yards Share 66.7% SR, 4.33 Y/C
- Floods are favorite passes —> 11 Crosses 63.6% SR, 8 PA Boots 50% SR, 5 Sail 100% SR, 14% Yards
- Eye Candy+ IZ Zones —> 4.5% Play Share 78.6% SR, 4.8% Yard Share
- Solo Fades on RPOs, presnap green light
** Others include spacing, switches, Levels+Corner, OZs
More diverse script YOY, more unpredictable
3. Kendall Milton
** Team high rushing SR 52.4%, Y/C 6.38, 14.1% of Team Carries
- 1st in YAC average (4.29)
-Top3 in Broken Tackle Rate (52.4%), Explosive Run Rate (28.6%),
- Top10 Rushing SR behind the chains (37.5%),
White’s carry share is 42.9%, Cook is 11.4%, McIntosh is 12.8%
4. where the dickens is george pickens
** 3rd on team in targets
- only 1/5 on deep targets
- only 3/7 on intermediate targets
**Dig (13), and Go (11) most targeted routes —43.5% catch rate
- 43.5% Success Rate, 56.5% Catch Rate, 6.09 Y/T, 4.35% Explosive Catch Rate, 14.6 ADOT
- only 3 uncatchable targets
- only 2/8 on contested targets 2.5 Y/T (35% contested rate)
Kentucky:
- The Big Blue Wall (OL, run game)
- This just won’t pass as a passing game (pass game issues)
**Only team to not complete a tight window throw; Poor Sack Rate, Pressure Rate allowed
** Wilson 3/11 on deep attempts (4th in deep accuracy), 2nd highest OVR Drop Rate (13%)
**2nd highest Screen Rate (14%), 6th highest RPO Rate (16%), 5th lowest ADOT (7.17), YAC% 36.7% (14th)
**passes targeting less than 5 yards 4th highest Target Rate, 2nd highest Completion Rate, 1st highest Yard Rate
13th Passing Success Rate (32%), Y/P (5.17),
10th EXP (7.20%), 11th in Broken Pass Play Rate 16.8%, 11th in YAC average
Josh Ali 33.3% Target Share, 13/30 First Downs, 5 drops, 4/7 Exp Catches
3. In defense of their defense
4. The Cats core run plays
Cats still good at its favorite plays
- IZ Slam Read: 20.9% Play Share, 21.8% Yard Share, 5.48 Y/A, 52.4% SR
- IZ Bluff Read: 9.93% Play Share, 12.1% Yard Share, 6.40 Y/A, 60% SR
- Power Veer: 4.4% Play Share, 5.2% Yard Share, 6.31 Y/A, 53.9% SR
- Counter Read: 3.6% Play Share, 8% Yard Share, 11.5 Y/A, 72.7% SR
Bash Counter, Nakie Toss Read, QB Draw, IZ Triple also wrinkles but none own a 50% SR
Mesh 8(50%), Slants 14 (50%), All Verts 8 (0%), Floods 10 (40%) favorite passes
Missouri:
- Have a Drinkwitz (offensive creativity)
Most creative scheme in the SEC. Getting the most out of a lackluster roster. Playing to his QBs strengths and scheming space in the run game. 48 concepts with at least one rep
IZ Read+OZ most called looks 13.6% Play Share similar Yard Share ~10.5%
Tackle Counter Reads only other play with at least 20 reps 52.4% SR, 5.71 Y/A
Empty+ Veer, Shovel, Jet
Triple Option ( IZ 9 reps, Tackle Counter 6 reps) —> zone far worse returns 22.2% SR vs 50% SR
Shock, Poker, Shallow, Sail, PA Boot, Spot/Triangle most seen passes in dropback game
4th highest EXPass Rate 11%, 2nd lowest EXRun Rate 10%
very heavy early run rate — 3rd highest —> Use methodical, eye candy run game to set up shots
**3rd most presnap motion 18.1%, 2nd most Jet motion 16.7%, 2nd most Orbit motion 6.79%
2. Bazelak Attack (numbers, comments)
OVR SR | 1DTD% | INTA% | EXP% | ADOT | scrn+RPO% | Depth Adj Acc% | 10+ SR | 10+ Acc% | 10+ INTA% | PRE DAA% | PRE INTA% | PRE SR | 3D SR | 3D DAA% | 3D PRE% | |
Bazelak | 52.5% (4th) | 41.4% (4th) | 5.05% (2nd) | 13.1% (3rd) | 9.07 (6th) | 9.06% | 47.2% (10th) | 48.5% (7th) | 42.4% (9th) | 9.09% (6th) | 25.1% (13th) | 8.70% (10th) | 26.1% (11th) | 50.0% (4th) | 64.0% (3rd) | 26.9% (4th) |
SEC AVR | 47.1% | 37.6% | 7.08% | 10.6% | 8.66 | 23% | 50.3% | 47.6% | 46.6% | 12.1 | 42.8% | 8.85% | 33.3% | 41.7% | 49.8% | 30.5% |
3. Golden on the money down (top5 O, top3 D)
3rd Down | OVR SR | AVR Distance | Pass SR | Run SR | Short ( <3) | Long (>6) |
OFF | 48.3% (4th) | 5.70 (1st) | 46.3% (5th) | 52.6% (10th) | 77.8% (4th) | 40.6% (4th) |
DEF | 65.2% (3rd) | 7.26 (4th) | 70.9% (4th) | 30.0% (12th) | 25% (t-10th) | 74.1% (5th) |
4. bad after contact ( not great physical runners — career for badie, rountree)
2020 SR | 2020 YBC | 2020 YAC | 2020 BT% | 1DTD% | 2019 SR | 2019 YBC | 2019 YAC | 2018 SR | 2018 YBC | 2018 YAC | |
Rountree | 49.4% (18th) | 2.60 (13th) | 1.95 (28th) | 25.3% (14th) | 27.6% (20th) | 37.1% | 1.78 | 2.70 | 48.5% | 2.46 | 2.65 |
Badie | 53.6% (13th) | 1.89 (26th) | 2.43 (18th) | 21.4% (23rd) | 21.4% (28th) | 43.5% | 2.42 | 1.86 | 51.9% | 2.86 | 2.32 |
- below average YAC all three years. When below average YBC, no instances of SR over 50%
- Mizzou 9th in YBC, 13th in YAC
South Carolina:
- King of the Hill (hill’s numbers versus hilinski’s last year)
OVR SR | 1DTD% | INTA% | EXP% | ADOT | scrn+RPO% | Depth Adj Acc% | 10+ SR | 10+ Acc% | 10+ INTA% | PRE DAA% | PRE INTA% | PRE SR | 3D SR | 3D DAA% | 3D PRE% | |
Hill | 44.2% (8th) | 35.9% (8th) | 5.77% (6th) | 10.9% (6th) | 7.25 (11th) | 22.4% | 48.7% (7th) | 43.9% (9th) | 48.8% (5th) | 7.32% (3rd) | 42.6% (7th) | 7.50% (8th) | 32.5% (8th) | 42.9% (8th) | 41.2% (11th) | 30.9% (6th) |
SEC AVR | 47.1% | 37.6% | 7.08% | 10.6% | 8.66 | 23% | 50.3% | 47.6% | 46.6% | 12.1% | 42.8% | 8.85% | 33.3% | 41.7% | 49.8% | 30.5% |
Hilinski | 39.6% | 29.5% | 6.63% | 5.65% | 7.30 | 24.1% | 36.2% | 29.3% | 28.3% | 13.1% | 31.8% | 7.87% | 31.5% | 30.4% | 38.5% | 29.6% |
2. Fenwicked (the case for more carries)
Rush SR | YBC | YAC | EXR% | 1D+TD% | Gumption% | BT % | Share | |
Harris | 40.9% (29th) | 3.82 (2nd) | 1.94 (28th) | 9.68% (26th) | 29.0% (18th) | 4.30% (17th) | 22.6% (20th) | 58.9% |
Fenwick | 54.1% (11th) | 2.41 (16th) | 3.16 (7th) | 16.2% (12th) | 29.7% (16th) | 13.5% (3rd) | 40.5% (4th) | 23.4% |
SEC AVR | 47.7% | 2.39 | 2.53 | 13.6% | 28.8% | 4.05% | 25.5% | ** |
3. BoBoffense (Mike Bobo’s influence on offense year over year)
OFF YOY | OVR SR | Pass SR | Run SR | Early SR | 3D SR | Pass Rt | Early Pass Rt | RPO Rt | OVR EXP | Pass EXP | Run EXP | TD Rate | TO Rate | 3NOut% |
2020 | 42.3% (10th) | 40.5% (7th) | 44.3% (10th) | 41.9% (10th) | 39.7% (9th) | 52.9% (7th) | 46.9% (9th) | 14.3% (12th) | 11% (7th) | 9.55% (6th) | 12.7% (9th) | 5.03% (6th) | 1.48% (5th) | 22.4% (8th) |
2019 | 38.3% (11th) | 36.7% (11th) | 40.7% (9th) | 40.6% (10th) | 31.3% (12th) | 58.9% (4th) | 53.1% (4th) | 20.8% (11th) | 8.95% (13th) | 5.44% (12th) | 14.0% (10th) | 2.70% (12th) | 1.18% (4th) | 32.4% (13th) |
SCHEMES
- increased IZ Looks —> Slams with occasional Slashes: executing Slam Reads has helped run game!
- Good amount of I formation: Iso 3.6% Play Share, 53.6% SR, 10.6 Y/A
- Base similar numbers
- PA Boot most targeted pass followed by Slants, check downs, Smashes, mesh, all verts, levels
4. SCARred Defense (mediocre metrics, or defense at a glance)
Success Rate:
OVR 52.7% (12th), P 53.2% (7th), R 50.3% (11th)
Early Down:
OVR 49.5% (12th), P 46.6% (13th), R 51.0% (12th)
3rd Down:
OVR 64.9% (4th), P 71.1% (3rd), R 41.7% (6th)
TD Rate:
4.76% (8th)
Takeaway:
3.27% (5th)
3NOut:
30.2% (8th)
Score%:
37.7% (6th)
Explosive:
OVR 13.1% (11th), P 12.8% (11th), R 12.4% (8th)
Rush Yards:
YBC 2.47 (11th), YAC 2.32 (7th)
Pressure/Sack:
13.7% / 5.71% (13th / 8th)
HAVOC:
OVR 16.1% (11th), P 9.71% (12th), R 22.9% (9th)
Tennessee:
- Guarant — I don’t know
2. Manilla offense (schemes, bland tactics) —> leads to horrible 3rd Down Success
OVR SR | Pass SR | Run SR | Early Pass Rt | Early SR | Early Pass SR | Early Run SR | 3D SR | 3rd Avr Gain | RPO Rt | OVR EXP | Pass EXP | Run EXP | 3NOut% | |
2020 | 39.5% (11th) | 39.5% (9th) | 39.4% (12th) | 45.1% (11th) | 41.8% (11th) | 46.4% (5th) | 38.1% (11th) | 25% (14th) | 6.66 (8th) | 24.8% (7th) | 11% (8th) | 9.26% (7th) | 12.7% (7th) | 36.2% (14th) |
IZ Zone with Slants — shots and some crosses. so bland and predictable and boring
Heavy run on early down (with bad returns) sets JG up to fail.
3. Gray Area (eric gray stats)
Talent is there but thanks to the style of play, his returns are not great at all…
- 34.6% Success Rate, 12.4% EXR, 29.6% BT% holding 49% of the team’s carries
** has 24 of team’s 35 broken tackles
** 8/11 negative runs
** 15/34 first downs
** 10/18 explosive carries
4. Orange you glad I didn’t forget to bring up the defense
Success Rate:
OVR 53.6% (11th), P 49.7% (12th), R 53.2% (10th)
Early Down:
OVR 53.8% (11th), P 49.1% (11th), R 54.9% (10th)
3rd Down:
OVR 52.2% (10th), P 51.4% (9th), R 40.0% (7th)
TD Rate:
3.70% (4th)
Takeaway:
1.99% (10th)
3NOut:
26.3% (12th)
Score%:
43.9% (10th)
Explosive:
OVR 12.3% (9th), P 13.9% (13th), R 11.6% (6th)
Rush Yards:
YBC 1.74 (4th), YAC 2.37 (9th)
Pressure/Sack:
17.4% / 6.21% (10th / 5th)
HAVOC:
OVR 15.6% (13th), P 9.94% (11th), R 20.0% (13th)